
User Guide

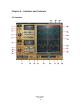
Table Of Contents
14. Capture has two modes, Automatic & Manual, which capture up to tw
o seconds
of signal at
44.1/48 kHz or one second at 88.2/9
6 kHz.
o Automatic – When you click Capture, the mechanism will wait for a signal
peak above -40 dBFS. When the fir
s
t peak exceeds -40 dBFS, it will
automatically capture the next one or two seconds (depending on the sample
rate), and then stop.
o Manual – Click Capture
to begin capturing, and click it again t
o stop.
In both modes, Capture time is limited to one or two seconds, depending on sample
rate.
15.
Scroll Bar scrolls the x axis of the captured
waveform.
16. Correlation Meter displays the general correlation value metering between the
captured Alpha and Beta waveforms, at the out
put of the de
lay and phase
processing
applied. The values move between 1 and -1; the
higher the value, the
better the correlation.
0 indicates no correlatio
n between the signals.
1 indicates maximum correlation (identical signa
ls).
-1 means the signals are completely out of phase.
17. Correlation Markers
display the maximum value of the correlation
meter. Blue
represents peak correlation value; orange represents negative peak value. If the
negative correlation exceeds the po
sitive, try flipping the phase on one of
the
sections.
18. Correlation Value Box displays
the current correlation value, and upd
ates in
real time.
19. Zoom X
zooms in on the x axis, at up to sa
mple resolution.
Waves InPhase
User Guide
9