
Specifications

5.6. DESIGN EVALUATION
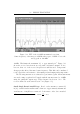
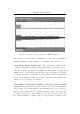
Figure 5.12: FFT of the 134.2kHz transmitted waveform.
Centre frequency of the image is 127kHz with a span of 50kHz. Notice the
strong peak at 134.2kHz
129kHz. This limits the maximum “Q” to approximately 11
7
. Figure 5.13
shows the received waveform from a tag with a well-tuned antenna. Notice,
however, that one of the received frequencies is still favoured. Temperature
changes greatly affected the tuned centre frequency. This drift can be attributed
to the capacitance and resistance of the tuning circuit changing with temperature.
The following antennae were evaluated for performance gains. All me asurements
were made using a regulated 12V supply with the antennae tuned to 129kHz
using the push-pull output stage design discussed in Section 5.4.2. The
receiver chain was as shown in Section 5.4.3 (Figure 5.7).
Small Single Round 100µH Loop Based on the antenna recommended
in [13], a small circular antenna with a diameter of approximately 100mm and
an inductance of 100µH was constructed. Performance of the device matched
7
11kHz bandwidth with a centre at 129kHz:
129
11
= 11.73
51