
User's Manual
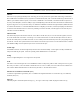
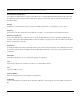
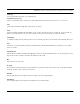
Table Of Contents
- Chapter 1 Introduction
- Features and Benefits
- Transparent Ethernet Bridging with Advanced Filtering for Security and Network Reliability
- IP Routing with Advanced Filtering for Security
- SNMP Management
- SNMP Features
- SNMP Management
- IP-Router Features
- Encryption Features (Add-on Option)
- Wireless Multipoint Protocol
- Additional Functionality for SPEEDLAN 4100 & 4200
- Features
- Chapter 2 Quick Start
- System Description
- Package Contents
- Installation Steps
- Installation Diagram
- Polarizations on a Grid Antenna
- Chapter 3 Hardware
- Upgrading the Firmware
- Chapter 4 Overview of Configurator
- Installation and Setup
- Toolbar and Menus
- Chapter 5 Configuring SPEEDLAN 4100 & 4200
- General Setup
- Interface & Advanced Interface Setup
- The Setup Buttons
- Chapter 6 Bridging Setup
- Bridge Setup
- Chapter 7 Setting Up the IP Addresses (IP Host Setup)
- Part I - Quick Overview of IP Addressing
- Part II - Setting Up the IP Address
- Chapter 8 IP-Router Setup
- IP Routing Setup
- Chapter 9 SNMP Setup
- SNMP Setup
- Chapter 10 System Access Setup
- System Access Setup
- Chapter 11 SNMP Monitoring
- Remote Statistics
- Interface Monitor
- Ethernet-like Interface Monitor
- Campus PRC Station Entries
- 11Mb RF Interface
- SNMP Monitor
- IP Monitor
- IP/TCP/UDP Monitor
- ICMP Monitor
- Chapter 12 Tables
- System Information
- Bridge Learn Table
- IP ARP Table
- IP Route Table
- IP/TCP Connection Table
- IP/UDP Listener Table
- Local IP-Address Table
- Chapter 13 Analyzing Wireless Equipment
- Select Another Device
- Analysis Polling Interval
- Wireless Link Test
- Antenna Alignment
- Glossary for Standard Data Communications
- Glossary for Standard Data Communications
- Appendix Protocols & Ethernet Addresses
- Common Ethernet Protocols
- Common Ethernet Vendor Addresses
- Common Ethernet Multicast Addresses
- Common Ethernet Broadcast Addresses

SPEEDLAN 4100 & 4200 Installation and Operation User Guide
Analyzing Wireless Equipment 13-7
Important Wireless Statistics
Some of the most important wireless statistics are the following:
• Link Quality
This displays the quality of the link.
• Green = Good activity
• Yellow = Acceptable activity
• Red = Poor activity
• SNR (Signal-to-Noise Ratio)
Number of the signal subtracted by the number of noise. The higher the SNR is, the better.
• Signal
The ratio of the standard deviation of the signal to the standard deviation of the noise.
• Noise
Since the spread spectrum signals run clearly, the noise level is usually very low. The lower
the noise, the better.
• Packets
This displays the percentage of test packets successfully received at each end. A higher per-
centage is better.
If you are loosing a large percentage of packets, try realigning the antenna or
changing its polarization (keeping in mind tht the antenna polarization must be the
same at both ends of the wirless link. Then, run the wireless link test again.
• Log
You can log the results of the link test into an ASCII text file. You can run the performance
over time and create a graphic to view the past to current results.
8 To exit this test, click Quit. Rerun the wireless link test after you have configured each
brouter or implemented any antenna alignments to verify that all equipment is communicat-
ing successfully.
9 Fine tune antennas to maximize signal level at each site and repeat the link test again to
confirm good performance.
TIP