
User's Manual
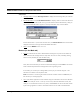
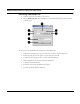
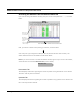
Table Of Contents
- Chapter 1 Introduction
- Features and Benefits
- Equipment Features
- SPEEDLAN K2's Polling Protocol -- How it Works in Star Networks
- SPEEDLAN 9000 Mesh Protocol -- How It Works in Non-Line-of-Sight Networks
- Chapter 2 Installing the SPEEDLAN 9101 & SPEEDLAN 9102 Hardware
- Rooftop and Tower Installations Warning
- Hardware Overview
- Drawings of Outdoor, Remote-Mounted Components
- The SPEEDLAN 9101 (with an Attached Standard Omni)
- The SPEEDLAN 9102 (with an External Antenna)
- Chapter 3 Using the SPEEDLAN 9000 Configurator
- Initial Configuration of the SPEEDLAN 9000
- Overview of the SPEEDLAN 9000 Configurator Main Menu
- Logging on to the SPEEDLAN 9000 Configurator
- Interfaces
- System
- Routing
- Wireless
- DHCP Server
- DHCP Relay
- NAT
- Diagnostics & Troubleshooting
- Administrative Access Pages
- Chapter 4 Using SPEEDView
- What is SPEEDView?
- System Requirements
- Installation Instructions
- Starting SPEEDView
- The Program Instructions
- The Main Tab
- Options Tab
- Admin Tab
- Chapter 5 Basics of IP Addressing
- Basics of IP Addressing
- Glossary for Standard Data Communications
- Glossary for Standard Data Communications
- Software License Agreement

SPEEDLAN 9000 Installation and Operation User Guide
Using SPEEDView 4-17
• Noise & Signal: A combined graphical depiction of signal and noise percentage.
• Link Quality: The percentage of polls the CPE responds to. The higher the number, the
better. This displays the quality of the link. Light green = good activity (50% or higher). Dark
green = acceptable activity. Yellow = Poor activity).
• Polls: The number of times the station has been polled.
• Missed (Polls): The number of polls that the base station sent that the CPE did not respond
to. This statistic is also updated every 3 seconds.
• Packets: The number of packets that were received (downstream, upstream or combined).
• Bytes: The number of bytes that were sent to the interface.
• Kbits/s: The current bandwidth (downstream, upstream or combined).
• Mbits/s: The current bandwidth (downstream, upstream or combined).
• Peak Kbits/s: The highest rate of data transfer reached (downstream, upstream or com-
bined).
• Peak Mbits/s: The highest rate of data transfer reached (downstream, upstream or com-
bined).
• Protocols: (UDP, TCP, ICMP, HTTP, POP3, SMTP, TELNET, FTP, FTP_DATA and SSH).
Notes:
• Statistics related to mesh networks on this tab are the following: hostname, Mbits/s, IP
address, Peak Mbits/s, RSSI, Rx Pwr (dBm), Kbits/s and Peak Kbits/s.
• Statistics related to star networks on this tab are the following: Hostname, Noise (dBm),
Packets, Protocol-related information, IP address, Bytes, Uptime, Noise and signal, Kbits/s,
RSSI, Link quality, Peak Kbits/s, Noise, Polls, Mbits/s, Rx Power (dBm), Missed polls and Peak
Mbits/s.
Noise: gray = noise
Signal:
Light green = good activity,
Dark green = acceptable activity,
and yellow = poor activity