
User manual


Voltsoft User Manual Version 2.0
99
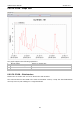
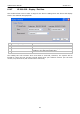
6.10.9 IR 1200-50D – Graph View
Our graph supports the following operations
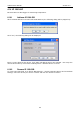
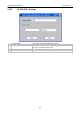
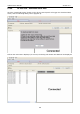
6.10.10 IR 1200-50D – Web Interface
Please refer to section 5.6 on how to launch the web interface.
The web interface for IR 1200-50D is the same as Windows version, except the downloaded
data can only have 10,000 readings in a single download.
1 Mouse wheel Zoom-in / Zoom-Out
2 Mouse click and drag Zoom-in
3 Shift + mouse click Pan
4 Mouse over on point Display reading values