
User manual


Chart
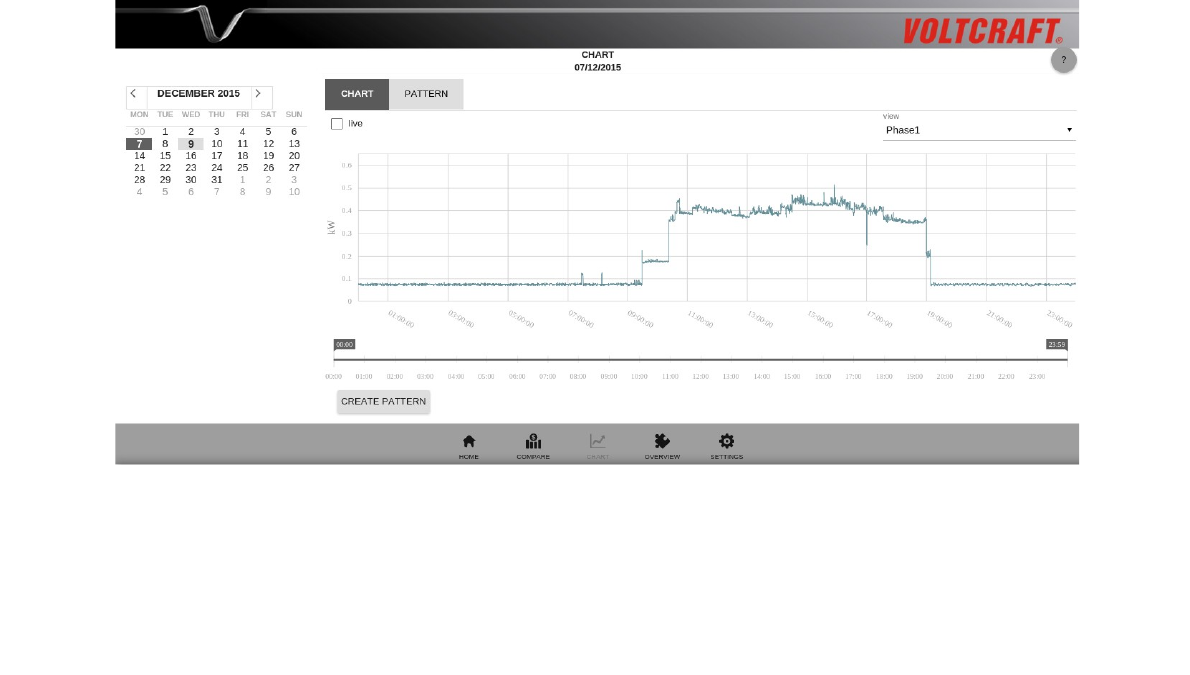
Main window
In the main window there are the tabs chart and pattern, further tabs are opened upon viewing
patterns.
In the tab chart the energy consumption can be shown for a maximum time period of 24 hours. Per
default the energy consumption of the current day is shown. When you move the mouse over the
chart, a small pop-up window opens which shows the time and the power measured at this point in
the chart.
Functions of the tab chart:
• Phase selection: In the drop down menu in the upper right part of the main window, you can
choose between the three phases. When “All 3 phases” is selected, the sum of the three
phases is shown.
• Zoom: With the time scale below the chart one can zoom into parts of the chart and out
again. Alternatively, one can also zoom into the chart by clicking on a start and end time
directly in the chart.
• Pattern creation: In order to create a pattern, continue zooming into the chart until you
reduced the view to the desired part. Then click on the button “Create pattern” below the
time scale and scroll down. Here you can fill in the fields Name, Category and Phase for the
pattern. Choose “mobile appliance” if the pattern belongs to a device that can be run on
different phases (e. g. in different rooms).
When you choose a section for pattern creation it is important, that this section contains both
the switching-on and the switching-off of a certain device. If you want to create a pattern for
the recognition of your washing machine, for example, you should choose the section such
that the complete washing procedure is contained. For switching devices like e. g. the
4