
User manual


User guide Voltcraft SEM-PRO 5000
Home
Main menu
The main menu can be found in the lower part of the window. Here you can choose between the
items Home, Compare, Chart, Overview and Settings.
Time window
You can choose between the time periods Day, Week, Month or Year. In the calendar you can pick
the desired time. The present day is shown in boldface. Below the calendar you can choose the unit
in which the values are shown, possible units are costs (in the configured currency), energy
consumption (in kWh) or emission (in CO
2
). The user interface reloads automatically after clicking
a button.
Main window
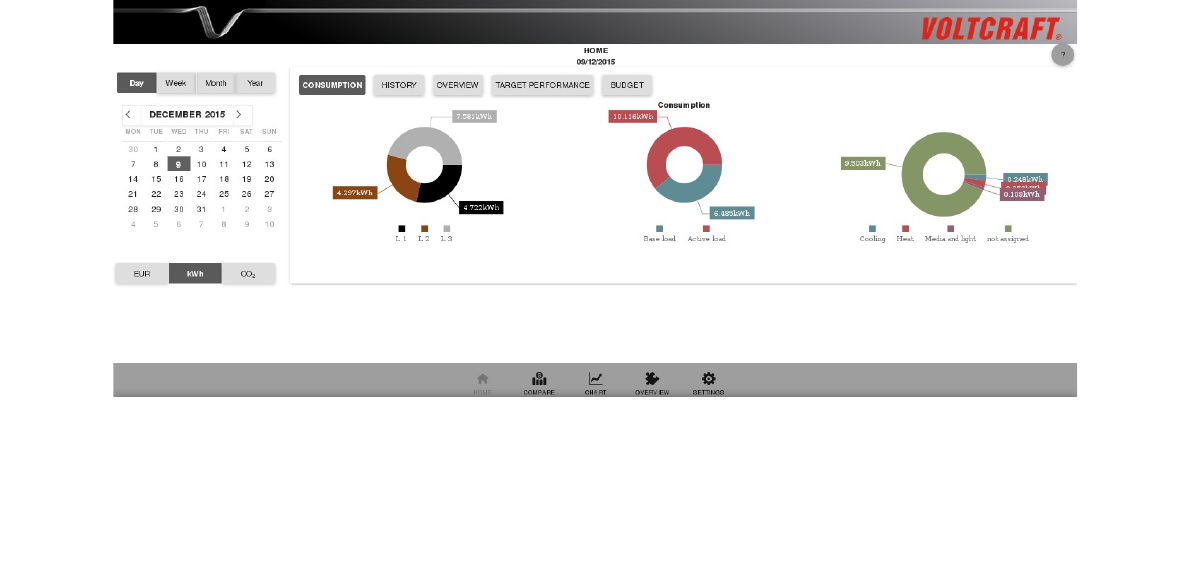
You can show or hide the views Consumption, History, Overview, Target performance and Budget
by clicking on the respective buttons. Multiple views can be selected at the same time.
• Consumption: The three doughnut charts show how the consumption is distributed to the 3
phases, to base load and active load and to the different consumption classes (heat, cooling,
washing, media and light and “not assigned”).
• History: The bar chart shows the energy consumption within the selected time period in the
next smaller unit. Clicking on one of the bars shows the bar chart in the next smaller unit.
• Overview: The left column shows the total consumption within the selected time period and
the minimum, maximum and mean within this period. The right column shows the currently
1