
6.7


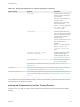

Table Of Contents
- vSphere Networking
- Contents
- About vSphere Networking
- Introduction to vSphere Networking
- Setting Up Networking with vSphere Standard Switches
- Setting Up Networking with vSphere Distributed Switches
- vSphere Distributed Switch Architecture
- Create a vSphere Distributed Switch
- Upgrade a vSphere Distributed Switch to a Later Version
- Edit General and Advanced vSphere Distributed Switch Settings
- Managing Networking on Multiple Hosts on a vSphere Distributed Switch
- Tasks for Managing Host Networking on a vSphere Distributed Switch
- Add Hosts to a vSphere Distributed Switch
- Configure Physical Network Adapters on a vSphere Distributed Switch
- Migrate VMkernel Adapters to a vSphere Distributed Switch
- Create a VMkernel Adapter on a vSphere Distributed Switch
- Migrate Virtual Machine Networking to the vSphere Distributed Switch
- Use a Host as a Template to Create a Uniform Networking Configuration on a vSphere Distributed Switch
- Remove Hosts from a vSphere Distributed Switch
- Managing Networking on Host Proxy Switches
- Distributed Port Groups
- Working with Distributed Ports
- Configuring Virtual Machine Networking on a vSphere Distributed Switch
- Topology Diagrams of a vSphere Distributed Switch in the vSphere Web Client
- Setting Up VMkernel Networking
- VMkernel Networking Layer
- View Information About VMkernel Adapters on a Host
- Create a VMkernel Adapter on a vSphere Standard Switch
- Create a VMkernel Adapter on a Host Associated with a vSphere Distributed Switch
- Edit a VMkernel Adapter Configuration
- Overriding the Default Gateway of a VMkernel Adapter
- Configure the VMkernel Adapter Gateway by Using esxcli Commands
- View TCP/IP Stack Configuration on a Host
- Change the Configuration of a TCP/IP Stack on a Host
- Create a Custom TCP/IP Stack
- Remove a VMkernel Adapter
- LACP Support on a vSphere Distributed Switch
- Backing Up and Restoring Networking Configurations
- Rollback and Recovery of the Management Network
- Networking Policies
- Applying Networking Policies on a vSphere Standard or Distributed Switch
- Configure Overriding Networking Policies on Port Level
- Teaming and Failover Policy
- VLAN Policy
- Security Policy
- Traffic Shaping Policy
- Resource Allocation Policy
- Monitoring Policy
- Traffic Filtering and Marking Policy
- Traffic Filtering and Marking on a Distributed Port Group or Uplink Port Group
- Enable Traffic Filtering and Marking on a Distributed Port Group or Uplink Port Group
- Mark Traffic on a Distributed Port Group or Uplink Port Group
- Filter Traffic on a Distributed Port Group or Uplink Port Group
- Working with Network Traffic Rules on a Distributed Port Group or Uplink Port Group
- Disable Traffic Filtering and Marking on a Distributed Port Group or Uplink Port Group
- Traffic Filtering and Marking on a Distributed Port or Uplink Port
- Enable Traffic Filtering and Marking on a Distributed Port or Uplink Port
- Mark Traffic on a Distributed Port or Uplink Port
- Filter Traffic on a Distributed Port or Uplink Port
- Working with Network Traffic Rules on a Distributed Port or Uplink Port
- Disable Traffic Filtering and Marking on a Distributed Port or Uplink Port
- Qualifying Traffic for Filtering and Marking
- Traffic Filtering and Marking on a Distributed Port Group or Uplink Port Group
- Manage Policies for Multiple Port Groups on a vSphere Distributed Switch
- Port Blocking Policies
- Isolating Network Traffic by Using VLANs
- Managing Network Resources
- DirectPath I/O
- Single Root I/O Virtualization (SR-IOV)
- SR-IOV Support
- SR-IOV Component Architecture and Interaction
- vSphere and Virtual Function Interaction
- DirectPath I/O vs SR-IOV
- Configure a Virtual Machine to Use SR-IOV
- Networking Options for the Traffic Related to an SR-IOV Enabled Virtual Machine
- Using an SR-IOV Physical Adapter to Handle Virtual Machine Traffic
- Enabling SR-IOV by Using Host Profiles or an ESXCLI Command
- Virtual Machine That Uses an SR-IOV Virtual Function Fails to Power On Because the Host Is Out of Interrupt Vectors
- Remote Direct Memory Access for Virtual Machines
- Jumbo Frames
- TCP Segmentation Offload
- Enable or Disable Software TSO in the VMkernel
- Determine Whether TSO Is Supported on the Physical Network Adapters on an ESXi Host
- Enable or Disable TSO on an ESXi Host
- Determine Whether TSO Is Enabled on an ESXi Host
- Enable or Disable TSO on a Linux Virtual Machine
- Enable or Disable TSO on a Windows Virtual Machine
- Large Receive Offload
- Enable Hardware LRO for All VMXNET3 Adapters on an ESXi Host
- Enable or Disable Software LRO for All VMXNET3 Adapters on an ESXi Host
- Determine Whether LRO Is Enabled for VMXNET3 Adapters on an ESXi Host
- Change the Size of the LRO Buffer for VMXNET 3 Adapters
- Enable or Disable LRO for All VMkernel Adapters on an ESXi Host
- Change the Size of the LRO Buffer for VMkernel Adapters
- Enable or Disable LRO on a VMXNET3 Adapter on a Linux Virtual Machine
- Enable or Disable LRO on a VMXNET3 Adapter on a Windows Virtual Machine
- Enable LRO Globally on a Windows Virtual Machine
- NetQueue and Networking Performance
- vSphere Network I/O Control
- About vSphere Network I/O Control Version 3
- Enable Network I/O Control on a vSphere Distributed Switch
- Bandwidth Allocation for System Traffic
- Bandwidth Allocation for Virtual Machine Traffic
- About Allocating Bandwidth for Virtual Machines
- Bandwidth Allocation Parameters for Virtual Machine Traffic
- Admission Control for Virtual Machine Bandwidth
- Create a Network Resource Pool
- Add a Distributed Port Group to a Network Resource Pool
- Configure Bandwidth Allocation for a Virtual Machine
- Configure Bandwidth Allocation on Multiple Virtual Machines
- Change the Quota of a Network Resource Pool
- Remove a Distributed Port Group from a Network Resource Pool
- Delete a Network Resource Pool
- Move a Physical Adapter Out the Scope of Network I/O Control
- MAC Address Management
- Configuring vSphere for IPv6
- Monitoring Network Connection and Traffic
- Capture Network Packets by Using the PacketCapture Utility
- Capturing and Tracing Network Packets by Using the pktcap-uw Utility
- pktcap-uw Command Syntax for Capturing Packets
- pktcap-uw Command Syntax for Tracing Packets
- pktcap-uw Options for Output Control
- pktcap-uw Options for Filtering Packets
- Capturing Packets by Using the pktcap-uw Utility
- Trace Packets by Using the pktcap-uw Utility
- Configure the NetFlow Settings of a vSphere Distributed Switch
- Working With Port Mirroring
- vSphere Distributed Switch Health Check
- Switch Discovery Protocol
- Configuring Protocol Profiles for Virtual Machine Networking
- Multicast Filtering
- Stateless Network Deployment
- Networking Best Practices
- Troubleshooting Networking
- Guidelines for Troubleshooting
- Troubleshooting MAC Address Allocation
- Unable to Remove a Host from a vSphere Distributed Switch
- Hosts on a vSphere Distributed Switch Lose Connectivity to vCenter Server
- Hosts on vSphere Distributed Switch 5.0 and Earlier Lose Connectivity to vCenter Server
- Alarm for Loss of Network Redundancy on a Host
- Virtual Machines Lose Connectivity After Changing the Uplink Failover Order of a Distributed Port Group
- Unable to Add a Physical Adapter to a vSphere Distributed Switch
- Troubleshooting SR-IOV Enabled Workloads
- A Virtual Machine that Runs a VPN Client Causes Denial of Service for Virtual Machines on the Host or Across a vSphere HA Cluster
- Low Throughput for UDP Workloads on Windows Virtual Machines
- Virtual Machines on the Same Distributed Port Group and on Different Hosts Cannot Communicate with Each Other
- Attempt to Power On a Migrated vApp Fails Because the Associated Protocol Profile Is Missing
- Networking Configuration Operation Is Rolled Back and a Host Is Disconnected from vCenter Server

What to do next
Copy the pcap and pcap.gz files to a system that runs a graphical analyzer tool, such as Wireshark, and
examine the packet details.
Capturing and Tracing Network Packets by Using the
pktcap-uw Utility
Monitor the traffic that flows through physical network adapters, VMkernel adapters, and virtual machines
adapters, and analyze packet information by using the graphical user interface of network analysis tools
such as Wireshark.
In vSphere you can monitor packets on a host by using the pktcap-uw console utility. You can use the
utility without additional installation on an ESXi host. pktcap-uw provides many points in the host network
stack at which you can monitor traffic.
For detailed analysis of captured packets, you can save packet content from the pktcap-uw utility to files
in PCAP or PCAPNG format and open them in Wireshark. You can also troubleshoot dropped packets
and trace a packet's path in the network stack.
Note The pktcap-uw utility is not fully supported for backward compatibility across vSphere releases.
The options of the utility might change in the future.
pktcap-uw Command Syntax for Capturing Packets
Use the pktcap-uw utility to inspect the contents of packets while they traverse the network stack on an
ESXi host.
pktcap-uw Syntax for Capturing Packets
The pktcap-uw command has the following syntax for capturing packets at a certain place in the network
stack:
pktcap-uw switch_port_arguments capture_point_options filter_options output_control_options
Note Certain options of the pktcap-uw utility are designed for VMware internal use only and you should
use them only under the supervision of VMware Technical Support. These options are not described in
the vSphere Networking guide.
vSphere Networking
VMware, Inc. 207