
6.7


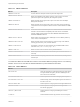


Table Of Contents
- vSphere Monitoring and Performance
- Contents
- About vSphere Monitoring and Performance
- Monitoring Inventory Objects with Performance Charts
- Performance Chart Types
- Data Counters
- Metric Groups in vSphere
- Data Collection Intervals
- Data Collection Levels
- View Performance Charts
- Performance Charts Options Available Under the View Menu
- Overview Performance Charts
- Clusters
- Data centers
- Datastores and Datastore Clusters
- Disk Space (Data Counters)
- Disk Space (File Types)
- Disk Space (Datastores)
- Disk Space (Virtual Machines)
- Space Allocated by Datastore in GB
- Space Capacity by Datastore in GB
- Storage I/O Control Normalized Latency
- Storage I/O Control Aggregate IOPs
- Storage I/O Control Activity
- Average Device Latency per Host
- Maximum Queue Depth per Host
- Read IOPs per Host
- Write IOPs Per Host
- Average Read Latency per Virtual Machine Disk
- Average Write Latency per Virtual Machine Disk
- Read IOPs per Virtual Machine Disk
- Write IOPs Per Virtual Machine Disk
- Virtual Machine Observed Latency per Datastore
- Hosts
- Resource Pools
- vApps
- Virtual Machines
- CPU (%)
- CPU Usage (MHz)
- Disk (Average)
- Disk (Rate)
- Disk (Number)
- Virtual Disk Requests (Number)
- Virtual Disk Rate (KBps)
- Memory (Usage)
- Memory (Balloon)
- Memory (Swap Rate)
- Memory (Data Counters)
- Network (Usage)
- Network (Rate)
- Network (Packets)
- Disk Space (Data Counters)
- Disk Space (Datastores)
- Disk Space (File Types)
- Fault Tolerance Performance Counters
- Working with Advanced and Custom Charts
- Troubleshoot and Enhance Performance
- Monitoring Guest Operating System Performance
- Monitoring Host Health Status
- Monitoring vSphere Health
- Monitoring Events, Alarms, and Automated Actions
- View Events
- View System Logs
- Export Events Data
- Streaming Events to a Remote Syslog Server
- Retention of Events in the vCenter Server Database
- View Triggered Alarms and Alarm Definitions
- Live Refresh of Recent Tasks and Alarms
- Set an Alarm in the vSphere Web Client
- Set an Alarm in the vSphere Client
- Acknowledge Triggered Alarms
- Reset Triggered Event Alarms
- Preconfigured vSphere Alarms
- Monitoring Solutions with the vCenter Solutions Manager
- Monitoring the Health of Services and Nodes
- Performance Monitoring Utilities: resxtop and esxtop
- Using the vimtop Plug-In to Monitor the Resource Use of Services
- Monitoring Networked Devices with SNMP and vSphere
- Using SNMP Traps with vCenter Server
- Configure SNMP for ESXi
- SNMP Diagnostics
- Monitor Guest Operating Systems with SNMP
- VMware MIB Files
- SNMPv2 Diagnostic Counters
- System Log Files
- View System Log Entries
- View System Logs on an ESXi Host
- System Logs
- Export System Log Files
- ESXi Log Files
- Upload Logs Package to a VMware Service Request
- Configure Syslog on ESXi Hosts
- Configuring Logging Levels for the Guest Operating System
- Collecting Log Files
- Viewing Log Files with the Log Browser
- Enable the Log Browser Plug-In on the vCenter Server Appliance
- Enable the Log Browser Plug-In on a vCenter Server Instance That Runs on Windows
- Retrieve Logs
- Search Log Files
- Filter Log Files
- Create Advanced Log Filters
- Adjust Log Times
- Export Logs from the Log Browser
- Compare Log Files
- Manage Logs Using the Log Browser
- Browse Log Files from Different Objects

Procedure
1 From the direct console, select View System Logs.
2 Press a corresponding number key to view a log.
vCenter Server agent (vpxa) logs appear if the host is managed by vCenter Server.
3 Press Enter or the spacebar to scroll through the messages.
4 (Optional) Perform a regular expression search.
a Press the slash key (/).
b Type the text to find.
c Press Enter
The found text is highlighted on the screen.
5 Press q to return to the direct console.
System Logs
VMware technical support might request several files to help resolve any issues you might have with the
product. This section describes the types and locations of log files found on ESXi hosts and
vSphere Web Client.
ESXi System Logs
You might need the ESXi system log files to resolve technical issues.
The ESXi system logs can be found in the /var/run/log directory.
vSphere Web Client Logs
You might need the vSphere Web Client system log files to resolve technical issues.
Depending on, whether you use a vCenter Server instance that runs on Windows, or a
vCenter Server Appliance, the vSphere Web Client system logs can be found in the location listed in the
table.
Table 11‑1. Location of vSphere Web Client Logs
vCenter Server System Location
vCenter Server that runs on Windows
C:\ProgramData\VMware\vCenterServer\logs\vsphere-
client\logs
vCenter Server Appliance
/var/log/vmware/vsphere-client/logs
The main vSphere Web Client log file is vsphere_client_virgo.log.
vSphere Monitoring and Performance
VMware, Inc. 198