
6.7


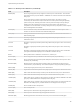


Table Of Contents
- vSphere Monitoring and Performance
- Contents
- About vSphere Monitoring and Performance
- Monitoring Inventory Objects with Performance Charts
- Performance Chart Types
- Data Counters
- Metric Groups in vSphere
- Data Collection Intervals
- Data Collection Levels
- View Performance Charts
- Performance Charts Options Available Under the View Menu
- Overview Performance Charts
- Clusters
- Data centers
- Datastores and Datastore Clusters
- Disk Space (Data Counters)
- Disk Space (File Types)
- Disk Space (Datastores)
- Disk Space (Virtual Machines)
- Space Allocated by Datastore in GB
- Space Capacity by Datastore in GB
- Storage I/O Control Normalized Latency
- Storage I/O Control Aggregate IOPs
- Storage I/O Control Activity
- Average Device Latency per Host
- Maximum Queue Depth per Host
- Read IOPs per Host
- Write IOPs Per Host
- Average Read Latency per Virtual Machine Disk
- Average Write Latency per Virtual Machine Disk
- Read IOPs per Virtual Machine Disk
- Write IOPs Per Virtual Machine Disk
- Virtual Machine Observed Latency per Datastore
- Hosts
- Resource Pools
- vApps
- Virtual Machines
- CPU (%)
- CPU Usage (MHz)
- Disk (Average)
- Disk (Rate)
- Disk (Number)
- Virtual Disk Requests (Number)
- Virtual Disk Rate (KBps)
- Memory (Usage)
- Memory (Balloon)
- Memory (Swap Rate)
- Memory (Data Counters)
- Network (Usage)
- Network (Rate)
- Network (Packets)
- Disk Space (Data Counters)
- Disk Space (Datastores)
- Disk Space (File Types)
- Fault Tolerance Performance Counters
- Working with Advanced and Custom Charts
- Troubleshoot and Enhance Performance
- Monitoring Guest Operating System Performance
- Monitoring Host Health Status
- Monitoring vSphere Health
- Monitoring Events, Alarms, and Automated Actions
- View Events
- View System Logs
- Export Events Data
- Streaming Events to a Remote Syslog Server
- Retention of Events in the vCenter Server Database
- View Triggered Alarms and Alarm Definitions
- Live Refresh of Recent Tasks and Alarms
- Set an Alarm in the vSphere Web Client
- Set an Alarm in the vSphere Client
- Acknowledge Triggered Alarms
- Reset Triggered Event Alarms
- Preconfigured vSphere Alarms
- Monitoring Solutions with the vCenter Solutions Manager
- Monitoring the Health of Services and Nodes
- Performance Monitoring Utilities: resxtop and esxtop
- Using the vimtop Plug-In to Monitor the Resource Use of Services
- Monitoring Networked Devices with SNMP and vSphere
- Using SNMP Traps with vCenter Server
- Configure SNMP for ESXi
- SNMP Diagnostics
- Monitor Guest Operating Systems with SNMP
- VMware MIB Files
- SNMPv2 Diagnostic Counters
- System Log Files
- View System Log Entries
- View System Logs on an ESXi Host
- System Logs
- Export System Log Files
- ESXi Log Files
- Upload Logs Package to a VMware Service Request
- Configure Syslog on ESXi Hosts
- Configuring Logging Levels for the Guest Operating System
- Collecting Log Files
- Viewing Log Files with the Log Browser
- Enable the Log Browser Plug-In on the vCenter Server Appliance
- Enable the Log Browser Plug-In on a vCenter Server Instance That Runs on Windows
- Retrieve Logs
- Search Log Files
- Filter Log Files
- Create Advanced Log Filters
- Adjust Log Times
- Export Logs from the Log Browser
- Compare Log Files
- Manage Logs Using the Log Browser
- Browse Log Files from Different Objects

Table 8‑10. Storage Adapter Panel Interactive Commands (Continued)
Command Description
w
Sorts by WRITES/s column.
R
Sorts by MBREAD/s read column.
T
Sorts by MBWRTN/s written column.
N
Sorts first by ADAPTR column, then by PATH column. This is the default sort order.
Storage Device Panel
The storage device panel displays server-wide storage utilization statistics.
By default, the information is grouped per storage device. You can also group the statistics per path, per
world, or per partition.
Table 8‑11. Storage Device Panel Statistics
Column Description
DEVICE Name of the storage device.
PATH Path name. This name is visible only if the corresponding device is expanded to paths. See the interactive
command p in Table 8‑12.
WORLD World ID. This ID is visible only if the corresponding device is expanded to worlds. See the interactive
command e in Table 8‑12. The world statistics are per world per device.
PARTITION Partition ID. This ID is visible only if the corresponding device is expanded to partitions. See interactive
command t in Table 8‑12.
NPH Number of paths.
NWD Number of worlds.
NPN Number of partitions.
SHARES Number of shares. This statistic is applicable only to worlds.
BLKSZ Block size in bytes.
NUMBLKS Number of blocks of the device.
DQLEN Current device queue depth of the storage device.
WQLEN World queue depth. This is the maximum number of ESXi VMkernel active commands that the world is
allowed to have. This is a per device maximum for the world. It is valid only if the corresponding device is
expanded to worlds.
ACTV Number of commands in the ESXi VMkernel that are currently active. This statistic applies to only worlds and
devices.
QUED Number of commands in the ESXi VMkernel that are currently queued. This statistic applies to only worlds
and devices.
%USD Percentage of the queue depth used by ESXi VMkernel active commands. This statistic applies to only
worlds and devices.
LOAD Ratio of ESXi VMkernel active commands plus ESXi VMkernel queued commands to queue depth. This
statistic applies to only worlds and devices.
CMDS/s Number of commands issued per second.
vSphere Monitoring and Performance
VMware, Inc. 169