
6.5.1


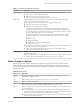
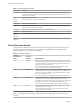
Table Of Contents
- vSphere Monitoring and Performance
- Contents
- About vSphere Monitoring and Performance
- Monitoring Inventory Objects with Performance Charts
- Performance Chart Types
- Data Counters
- Metric Groups in vSphere
- Data Collection Intervals
- Data Collection Levels
- View Performance Charts
- Performance Charts Options Available Under the View Menu
- Overview Performance Charts
- Clusters
- Data centers
- Datastores and Datastore Clusters
- Disk Space (Data Counters)
- Disk Space (File Types)
- Disk Space (Datastores)
- Disk Space (Virtual Machines)
- Storage I/O Control Normalized Latency
- Storage I/O Control Aggregate IOPs
- Storage I/O Control Activity
- Average Device Latency per Host
- Maximum Queue Depth per Host
- Read IOPs per Host
- Write IOPs Per Host
- Average Read Latency per Virtual Machine Disk
- Average Write Latency per Virtual Machine Disk
- Read IOPs per Virtual Machine Disk
- Write IOPs Per Virtual Machine Disk
- Virtual Machine Observed Latency per Datastore
- Hosts
- Resource Pools
- vApps
- Virtual Machines
- CPU (%)
- CPU Usage (MHz)
- Disk (Average)
- Disk (Rate)
- Disk (Number)
- Virtual Disk Requests (Number)
- Virtual Disk Rate (KBps)
- Memory (Usage)
- Memory (Balloon)
- Memory (Swap Rate)
- Memory (Data Counters)
- Network (Usage)
- Network (Rate)
- Network (Packets)
- Disk Space (Data Counters)
- Disk Space (Datastores)
- Disk Space (File Types)
- Fault Tolerance Performance Counters
- Working with Advanced and Custom Charts
- Troubleshoot and Enhance Performance
- Monitoring Guest Operating System Performance
- Monitoring Host Health Status
- Monitoring Events, Alarms, and Automated Actions
- View Events
- View System Logs
- Export Events Data
- Streaming Events to a Remote Syslog Server
- Retention of Events in the vCenter Server Database
- View Triggered Alarms and Alarm Definitions
- Live Refresh of Recent Tasks and Alarms
- Set an Alarm
- Acknowledge Triggered Alarms
- Reset Triggered Event Alarms
- Preconfigured vSphere Alarms
- Monitoring Solutions with the vCenter Solutions Manager
- Monitoring the Health of Services and Nodes
- Performance Monitoring Utilities: resxtop and esxtop
- Using the vimtop Plug-In to Monitor the Resource Use of Services
- Monitoring Networked Devices with SNMP and vSphere
- Using SNMP Traps with vCenter Server
- Configure SNMP for ESXi
- SNMP Diagnostics
- Monitor Guest Operating Systems with SNMP
- VMware MIB Files
- SNMPv2 Diagnostic Counters
- System Log Files
- View System Log Entries
- View System Logs on an ESXi Host
- System Logs
- Export System Log Files
- ESXi Log Files
- Upload Logs Package to a VMware Service Request
- Configure Syslog on ESXi Hosts
- Configuring Logging Levels for the Guest Operating System
- Collecting Log Files
- Viewing Log Files with the Log Browser
- Enable the Log Browser Plug-In on the vCenter Server Appliance
- Enable the Log Browser Plug-In on a vCenter Server Instance That Runs on Windows
- Retrieve Logs
- Search Log Files
- Filter Log Files
- Create Advanced Log Filters
- Adjust Log Times
- Export Logs from the Log Browser
- Compare Log Files
- Manage Logs Using the Log Browser
- Browse Log Files from Different Objects
- Index

n
“View Performance Charts,” on page 12
n
“Performance Charts Options Available Under the View Menu,” on page 12
n
“Overview Performance Charts,” on page 13
n
“Working with Advanced and Custom Charts,” on page 91
n
“Troubleshoot and Enhance Performance,” on page 93
Performance Chart Types
Performance metrics are displayed in dierent types of charts, depending on the metric type and object.
Table 1‑1. Performance Chart Types
Chart Type Description
Line chart Displays metrics for a single inventory object. The data for each performance counter is ploed on a
separate line in the chart. For example, a network chart for a host can contain two lines: one showing
the number of packets received, and one showing the number of packets transmied.
Bar chart Displays storage metrics for datastores in a selected data center. Each datastore is represented as a bar
in the chart. Each bar displays metrics based on the le type: virtual disks, snapshots, swap les, and
other les.
Pie chart Displays storage metrics for a single object, based on the le types, or virtual machines. For example, a
pie chart for a datastore can display the amount of storage space occupied by the virtual machines
taking up the largest space.
Stacked chart Displays metrics for the child objects that have the highest statistical values. All other objects are
aggregated, and the sum value is displayed with the term Other. For example, a host's stacked CPU
usage chart displays CPU usage metrics for the 10 virtual machines on the host that are consuming
the most CPU. The Other amount contains the total CPU usage of the remaining virtual machines.
The metrics for the host itself are displayed in separate line charts.
Stacked charts are useful in comparing the resource allocation and usage across multiple hosts or
virtual machines. By default, the 10 child objects with the highest data counter values are displayed.
Data Counters
Each data counter includes several aributes that are used to determine the statistical value collected. See
the vSphere API Reference for a complete list and description of supported counters.
Table 1‑2. Data Counter Attributes
Attribute Description
Unit of
Measurement
Standard in which the statistic quantity is measured.
n
Kilobytes (KB) – 1024 bytes
n
Kilobytes per second (KBps) – 1024 bytes per second
n
Kilobits (kb) – 1000 bits
n
Kilobits per second (kbps) – 1000 bits per second
n
Megabytes (MB)
n
Megabytes per second (MBps)
n
Megabits (Mb), megabits per second (Mbps)
n
Megaher (MHz)
n
Microseconds (µs)
n
Milliseconds (ms)
n
Number (#)
n
Percent (%)
n
Seconds (s)
Description Text description of the data counter.
vSphere Monitoring and Performance
8 VMware, Inc.