
6.5.1

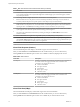


Table Of Contents
- vSphere Monitoring and Performance
- Contents
- About vSphere Monitoring and Performance
- Monitoring Inventory Objects with Performance Charts
- Performance Chart Types
- Data Counters
- Metric Groups in vSphere
- Data Collection Intervals
- Data Collection Levels
- View Performance Charts
- Performance Charts Options Available Under the View Menu
- Overview Performance Charts
- Clusters
- Data centers
- Datastores and Datastore Clusters
- Disk Space (Data Counters)
- Disk Space (File Types)
- Disk Space (Datastores)
- Disk Space (Virtual Machines)
- Storage I/O Control Normalized Latency
- Storage I/O Control Aggregate IOPs
- Storage I/O Control Activity
- Average Device Latency per Host
- Maximum Queue Depth per Host
- Read IOPs per Host
- Write IOPs Per Host
- Average Read Latency per Virtual Machine Disk
- Average Write Latency per Virtual Machine Disk
- Read IOPs per Virtual Machine Disk
- Write IOPs Per Virtual Machine Disk
- Virtual Machine Observed Latency per Datastore
- Hosts
- Resource Pools
- vApps
- Virtual Machines
- CPU (%)
- CPU Usage (MHz)
- Disk (Average)
- Disk (Rate)
- Disk (Number)
- Virtual Disk Requests (Number)
- Virtual Disk Rate (KBps)
- Memory (Usage)
- Memory (Balloon)
- Memory (Swap Rate)
- Memory (Data Counters)
- Network (Usage)
- Network (Rate)
- Network (Packets)
- Disk Space (Data Counters)
- Disk Space (Datastores)
- Disk Space (File Types)
- Fault Tolerance Performance Counters
- Working with Advanced and Custom Charts
- Troubleshoot and Enhance Performance
- Monitoring Guest Operating System Performance
- Monitoring Host Health Status
- Monitoring Events, Alarms, and Automated Actions
- View Events
- View System Logs
- Export Events Data
- Streaming Events to a Remote Syslog Server
- Retention of Events in the vCenter Server Database
- View Triggered Alarms and Alarm Definitions
- Live Refresh of Recent Tasks and Alarms
- Set an Alarm
- Acknowledge Triggered Alarms
- Reset Triggered Event Alarms
- Preconfigured vSphere Alarms
- Monitoring Solutions with the vCenter Solutions Manager
- Monitoring the Health of Services and Nodes
- Performance Monitoring Utilities: resxtop and esxtop
- Using the vimtop Plug-In to Monitor the Resource Use of Services
- Monitoring Networked Devices with SNMP and vSphere
- Using SNMP Traps with vCenter Server
- Configure SNMP for ESXi
- SNMP Diagnostics
- Monitor Guest Operating Systems with SNMP
- VMware MIB Files
- SNMPv2 Diagnostic Counters
- System Log Files
- View System Log Entries
- View System Logs on an ESXi Host
- System Logs
- Export System Log Files
- ESXi Log Files
- Upload Logs Package to a VMware Service Request
- Configure Syslog on ESXi Hosts
- Configuring Logging Levels for the Guest Operating System
- Collecting Log Files
- Viewing Log Files with the Log Browser
- Enable the Log Browser Plug-In on the vCenter Server Appliance
- Enable the Log Browser Plug-In on a vCenter Server Instance That Runs on Windows
- Retrieve Logs
- Search Log Files
- Filter Log Files
- Create Advanced Log Filters
- Adjust Log Times
- Export Logs from the Log Browser
- Compare Log Files
- Manage Logs Using the Log Browser
- Browse Log Files from Different Objects
- Index

Table 1‑101. Data Counters
Chart Label Description
Read Number of disk read commands completed on each virtual disk on the virtual
machine, per second. The aggregate number of all disk read commands per second is
also displayed in the chart.
Read rate = blocksRead per second × blockSize
n
Counter: read
n
Stats Type: Rate
n
Unit: Kilobytes per second (KBps)
n
Rollup Type: Average
n
Collection Level: 2
Write Number of disk write commands completed on each virtual disk on the virtual
machine, per second. The aggregate number of all disk write commands per second
is also displayed in the chart.
Write rate = blocksWrien per second × blockSize
n
Counter: write
n
Stats Type: Rate
n
Unit: Kilobytes per second (KBps)
n
Rollup Type: Average
n
Collection Level: 2
Chart Analysis
Use the disk charts to monitor average disk loads and to determine trends in disk usage. For example, you
might notice a performance degradation with applications that frequently read from and write to the hard
disk. If you see a spike in the number of disk read or write requests, check whether any such applications
were running then.
The best ways to determine if your vSphere environment is experiencing disk problems is to monitor the
disk latency data counters. You can use the advanced performance charts to view these statistics.
n
The kernelLatency data counter measures the average amount of time, in milliseconds, that the
VMkernel spends processing each SCSI command. For best performance, the value must be 0 -1
milliseconds. If the value is greater than 4 ms, the virtual machines on the host are trying to send more
throughput to the storage system than the conguration supports. Check the CPU usage, and increase
the queue depth.
n
The deviceLatency data counter measures the average amount of time, in milliseconds, to complete a
SCSI command from the physical device. Depending on your hardware, a number greater than 15 ms
indicates probable problems with the storage array. Move the active VMDK to a volume with more
spindles or add disks to the LUN.
n
The queueLatency data counter measures the average amount of time taken per SCSI command in the
VMkernel queue. This value must always be zero. If not, the workload is too high and the array cannot
process the data fast enough.
If the disk latency values are high, or if you notice other problems with disk I/O performance, consider
taking the following actions.
Chapter 1 Monitoring Inventory Objects with Performance Charts
VMware, Inc. 71