
6.5.1


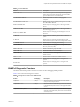
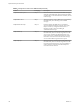
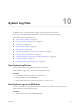
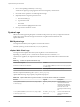


Table Of Contents
- vSphere Monitoring and Performance
- Contents
- About vSphere Monitoring and Performance
- Monitoring Inventory Objects with Performance Charts
- Performance Chart Types
- Data Counters
- Metric Groups in vSphere
- Data Collection Intervals
- Data Collection Levels
- View Performance Charts
- Performance Charts Options Available Under the View Menu
- Overview Performance Charts
- Clusters
- Data centers
- Datastores and Datastore Clusters
- Disk Space (Data Counters)
- Disk Space (File Types)
- Disk Space (Datastores)
- Disk Space (Virtual Machines)
- Storage I/O Control Normalized Latency
- Storage I/O Control Aggregate IOPs
- Storage I/O Control Activity
- Average Device Latency per Host
- Maximum Queue Depth per Host
- Read IOPs per Host
- Write IOPs Per Host
- Average Read Latency per Virtual Machine Disk
- Average Write Latency per Virtual Machine Disk
- Read IOPs per Virtual Machine Disk
- Write IOPs Per Virtual Machine Disk
- Virtual Machine Observed Latency per Datastore
- Hosts
- Resource Pools
- vApps
- Virtual Machines
- CPU (%)
- CPU Usage (MHz)
- Disk (Average)
- Disk (Rate)
- Disk (Number)
- Virtual Disk Requests (Number)
- Virtual Disk Rate (KBps)
- Memory (Usage)
- Memory (Balloon)
- Memory (Swap Rate)
- Memory (Data Counters)
- Network (Usage)
- Network (Rate)
- Network (Packets)
- Disk Space (Data Counters)
- Disk Space (Datastores)
- Disk Space (File Types)
- Fault Tolerance Performance Counters
- Working with Advanced and Custom Charts
- Troubleshoot and Enhance Performance
- Monitoring Guest Operating System Performance
- Monitoring Host Health Status
- Monitoring Events, Alarms, and Automated Actions
- View Events
- View System Logs
- Export Events Data
- Streaming Events to a Remote Syslog Server
- Retention of Events in the vCenter Server Database
- View Triggered Alarms and Alarm Definitions
- Live Refresh of Recent Tasks and Alarms
- Set an Alarm
- Acknowledge Triggered Alarms
- Reset Triggered Event Alarms
- Preconfigured vSphere Alarms
- Monitoring Solutions with the vCenter Solutions Manager
- Monitoring the Health of Services and Nodes
- Performance Monitoring Utilities: resxtop and esxtop
- Using the vimtop Plug-In to Monitor the Resource Use of Services
- Monitoring Networked Devices with SNMP and vSphere
- Using SNMP Traps with vCenter Server
- Configure SNMP for ESXi
- SNMP Diagnostics
- Monitor Guest Operating Systems with SNMP
- VMware MIB Files
- SNMPv2 Diagnostic Counters
- System Log Files
- View System Log Entries
- View System Logs on an ESXi Host
- System Logs
- Export System Log Files
- ESXi Log Files
- Upload Logs Package to a VMware Service Request
- Configure Syslog on ESXi Hosts
- Configuring Logging Levels for the Guest Operating System
- Collecting Log Files
- Viewing Log Files with the Log Browser
- Enable the Log Browser Plug-In on the vCenter Server Appliance
- Enable the Log Browser Plug-In on a vCenter Server Instance That Runs on Windows
- Retrieve Logs
- Search Log Files
- Filter Log Files
- Create Advanced Log Filters
- Adjust Log Times
- Export Logs from the Log Browser
- Compare Log Files
- Manage Logs Using the Log Browser
- Browse Log Files from Different Objects
- Index

Table 10‑2. vSphere Web Client Logs and Location on a vCenter Server That Runs on Windows
(Continued)
File Path Log File Description
C:\ProgramData\VMware\vCenterServer\logs\vspher
e-client\logs\virgo-server\
log.log ???
Contains information about
the plug-in bundle
communication.
C:\ProgramData\VMware\vCenterServer\logs\vspher
e-ui\logs
eventlog.log
Contains time stamps of
startup and shutdown of the
vSphere Web Client service.
C:\ProgramData\VMware\vCenterServer\logs\vspher
e-client\logs access\
vim-ngc-install.log ??
Contains information about
the installation of the
vSphere Web Client
including computer name,
Operating System revision,
the date of installation and
the number of revisions that
have been
installed/upgraded on the
system.
C:\Program Files\VMware\vCenter Server\VMware
Identity Services\wrapper\bin\
wrapper.log
Contains information about
the state of the Java runtime
environment.
Export System Log Files
When the vSphere Web Client is connected to vCenter Server, you can select hosts from which to download
system log les.
To save diagnostic data for ESXi hosts and vCenter Server, the vSphere Web Client must be connected to the
vCenter Server system.
Required privileges:
n
To view diagnostic data: Read-Only User
n
To manage diagnostic data: Global.Diagnostics
Procedure
1 In the inventory, navigate to a vCenter Server instance, and click the Monitor tab.
2 Click System Logs.
3 Click Export System Logs.
4 If you are connected to vCenter Server, select the object for which you want to export data.
Selecting an object selects all of its child objects.
5 If you are connected to vCenter Server, select Include information from vCenter Server and vSphere
Web Client to download vCenter Server and vSphere Web Client log les and host log les, and click
Next.
6 If the selected host supports manifest driven exports of system log les, select the system log les to
collect. Select the specic system log les to download.
If the host does not support manifest exports of log les, all system log les are exported.
7 Select Gather performance data to include performance data information in the log les.
You can update the duration and interval time you want the data collected.
Chapter 10 System Log Files
VMware, Inc. 167