
6.5.1


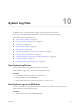


Table Of Contents
- vSphere Monitoring and Performance
- Contents
- About vSphere Monitoring and Performance
- Monitoring Inventory Objects with Performance Charts
- Performance Chart Types
- Data Counters
- Metric Groups in vSphere
- Data Collection Intervals
- Data Collection Levels
- View Performance Charts
- Performance Charts Options Available Under the View Menu
- Overview Performance Charts
- Clusters
- Data centers
- Datastores and Datastore Clusters
- Disk Space (Data Counters)
- Disk Space (File Types)
- Disk Space (Datastores)
- Disk Space (Virtual Machines)
- Storage I/O Control Normalized Latency
- Storage I/O Control Aggregate IOPs
- Storage I/O Control Activity
- Average Device Latency per Host
- Maximum Queue Depth per Host
- Read IOPs per Host
- Write IOPs Per Host
- Average Read Latency per Virtual Machine Disk
- Average Write Latency per Virtual Machine Disk
- Read IOPs per Virtual Machine Disk
- Write IOPs Per Virtual Machine Disk
- Virtual Machine Observed Latency per Datastore
- Hosts
- Resource Pools
- vApps
- Virtual Machines
- CPU (%)
- CPU Usage (MHz)
- Disk (Average)
- Disk (Rate)
- Disk (Number)
- Virtual Disk Requests (Number)
- Virtual Disk Rate (KBps)
- Memory (Usage)
- Memory (Balloon)
- Memory (Swap Rate)
- Memory (Data Counters)
- Network (Usage)
- Network (Rate)
- Network (Packets)
- Disk Space (Data Counters)
- Disk Space (Datastores)
- Disk Space (File Types)
- Fault Tolerance Performance Counters
- Working with Advanced and Custom Charts
- Troubleshoot and Enhance Performance
- Monitoring Guest Operating System Performance
- Monitoring Host Health Status
- Monitoring Events, Alarms, and Automated Actions
- View Events
- View System Logs
- Export Events Data
- Streaming Events to a Remote Syslog Server
- Retention of Events in the vCenter Server Database
- View Triggered Alarms and Alarm Definitions
- Live Refresh of Recent Tasks and Alarms
- Set an Alarm
- Acknowledge Triggered Alarms
- Reset Triggered Event Alarms
- Preconfigured vSphere Alarms
- Monitoring Solutions with the vCenter Solutions Manager
- Monitoring the Health of Services and Nodes
- Performance Monitoring Utilities: resxtop and esxtop
- Using the vimtop Plug-In to Monitor the Resource Use of Services
- Monitoring Networked Devices with SNMP and vSphere
- Using SNMP Traps with vCenter Server
- Configure SNMP for ESXi
- SNMP Diagnostics
- Monitor Guest Operating Systems with SNMP
- VMware MIB Files
- SNMPv2 Diagnostic Counters
- System Log Files
- View System Log Entries
- View System Logs on an ESXi Host
- System Logs
- Export System Log Files
- ESXi Log Files
- Upload Logs Package to a VMware Service Request
- Configure Syslog on ESXi Hosts
- Configuring Logging Levels for the Guest Operating System
- Collecting Log Files
- Viewing Log Files with the Log Browser
- Enable the Log Browser Plug-In on the vCenter Server Appliance
- Enable the Log Browser Plug-In on a vCenter Server Instance That Runs on Windows
- Retrieve Logs
- Search Log Files
- Filter Log Files
- Create Advanced Log Filters
- Adjust Log Times
- Export Logs from the Log Browser
- Compare Log Files
- Manage Logs Using the Log Browser
- Browse Log Files from Different Objects
- Index
Configure SNMP Management Client Software
After you have congured a vCenter Server instance or an ESXi host to send traps, congure your
management client software to receive and interpret those traps.
To congure your management client software, specify the communities for the managed device, congure
the port seings, and load the VMware MIB les. See the documentation for your management system for
specic instructions for these steps.
Prerequisites
To complete this task, download the VMware MIB les from the VMware website:
hp://communities.vmware.com/community/developer/managementapi. On the Web page, search
Downloading MIB modules.
Procedure
1 In your management software, specify the vCenter Server instance or ESXi host as an SNMP-based
managed device.
2 If you are using SNMPv1 or SNMPv2c, set up appropriate community names in the management
software.
These names must correspond to the communities set for the SNMP agent on the vCenter Server
instance or ESXi host.
3 If you are using SNMPv3, congure users and authentication and privacy protocols to match those
congured on the ESXi host.
4 If you congured the SNMP agent to send traps to a port on the management system other than the
default UDP port 162, congure the management client software to listen on the port you congured.
5 Load the VMware MIBs into the management software so you can view the symbolic names for
vCenter Server or the host variables.
To prevent lookup errors, load these MIB les in the following order before loading other MIB les:
a VMWARE-ROOT-MIB.mib
b VMWARE-TC-MIB.mib
c VMWARE-PRODUCTS-MIB.mib
The management software can now receive and interpret traps fromvCenter Server or ESXi hosts.
SNMP Diagnostics
You can use SNMP tools to diagnose conguration problems.
n
Run the esxcli system snmp test command from the vSphere CLI set to prompt the SNMP agent to
send a test warmStart trap.
n
Run the esxcli system snmp get command to display the current conguration of the SNMP agent.
n
The SNMPv2-MIB.mib le provides several counters to aid in debugging SNMP problems. See “SNMPv2
Diagnostic Counters,” on page 163.
n
The VMWARE-AGENTCAP-MIB.mib le denes the capabilities of the VMware SNMP agents by product
version. Use this le to determine if the SNMP functionality that you want to use is supported.
Chapter 9 Monitoring Networked Devices with SNMP and vSphere
VMware, Inc. 161