
6.5.1


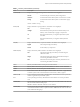

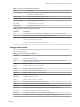
Table Of Contents
- vSphere Monitoring and Performance
- Contents
- About vSphere Monitoring and Performance
- Monitoring Inventory Objects with Performance Charts
- Performance Chart Types
- Data Counters
- Metric Groups in vSphere
- Data Collection Intervals
- Data Collection Levels
- View Performance Charts
- Performance Charts Options Available Under the View Menu
- Overview Performance Charts
- Clusters
- Data centers
- Datastores and Datastore Clusters
- Disk Space (Data Counters)
- Disk Space (File Types)
- Disk Space (Datastores)
- Disk Space (Virtual Machines)
- Storage I/O Control Normalized Latency
- Storage I/O Control Aggregate IOPs
- Storage I/O Control Activity
- Average Device Latency per Host
- Maximum Queue Depth per Host
- Read IOPs per Host
- Write IOPs Per Host
- Average Read Latency per Virtual Machine Disk
- Average Write Latency per Virtual Machine Disk
- Read IOPs per Virtual Machine Disk
- Write IOPs Per Virtual Machine Disk
- Virtual Machine Observed Latency per Datastore
- Hosts
- Resource Pools
- vApps
- Virtual Machines
- CPU (%)
- CPU Usage (MHz)
- Disk (Average)
- Disk (Rate)
- Disk (Number)
- Virtual Disk Requests (Number)
- Virtual Disk Rate (KBps)
- Memory (Usage)
- Memory (Balloon)
- Memory (Swap Rate)
- Memory (Data Counters)
- Network (Usage)
- Network (Rate)
- Network (Packets)
- Disk Space (Data Counters)
- Disk Space (Datastores)
- Disk Space (File Types)
- Fault Tolerance Performance Counters
- Working with Advanced and Custom Charts
- Troubleshoot and Enhance Performance
- Monitoring Guest Operating System Performance
- Monitoring Host Health Status
- Monitoring Events, Alarms, and Automated Actions
- View Events
- View System Logs
- Export Events Data
- Streaming Events to a Remote Syslog Server
- Retention of Events in the vCenter Server Database
- View Triggered Alarms and Alarm Definitions
- Live Refresh of Recent Tasks and Alarms
- Set an Alarm
- Acknowledge Triggered Alarms
- Reset Triggered Event Alarms
- Preconfigured vSphere Alarms
- Monitoring Solutions with the vCenter Solutions Manager
- Monitoring the Health of Services and Nodes
- Performance Monitoring Utilities: resxtop and esxtop
- Using the vimtop Plug-In to Monitor the Resource Use of Services
- Monitoring Networked Devices with SNMP and vSphere
- Using SNMP Traps with vCenter Server
- Configure SNMP for ESXi
- SNMP Diagnostics
- Monitor Guest Operating Systems with SNMP
- VMware MIB Files
- SNMPv2 Diagnostic Counters
- System Log Files
- View System Log Entries
- View System Logs on an ESXi Host
- System Logs
- Export System Log Files
- ESXi Log Files
- Upload Logs Package to a VMware Service Request
- Configure Syslog on ESXi Hosts
- Configuring Logging Levels for the Guest Operating System
- Collecting Log Files
- Viewing Log Files with the Log Browser
- Enable the Log Browser Plug-In on the vCenter Server Appliance
- Enable the Log Browser Plug-In on a vCenter Server Instance That Runs on Windows
- Retrieve Logs
- Search Log Files
- Filter Log Files
- Create Advanced Log Filters
- Adjust Log Times
- Export Logs from the Log Browser
- Compare Log Files
- Manage Logs Using the Log Browser
- Browse Log Files from Different Objects
- Index

Table 7‑3. Interactive Mode Single-Key Commands
Key Description
h or? Displays a help menu for the current panel, giving a brief summary of commands, and the status of secure
mode.
space Immediately updates the current panel.
^L Erases and redraws the current panel.
f or F Displays a panel for adding or removing statistics columns (text boxes) to or from the current panel.
o or O Displays a panel for changing the order of statistics columns on the current panel.
# Prompts you for the number of statistics rows to display. Any value greater than 0 overrides automatic
determination of the number of rows to show, which is based on window size measurement. If you change this
number in one resxtop (or esxtop) panel, the change aects all four panels.
s Prompts you for the delay between updates, in seconds. Fractional values are recognized down to
microseconds. The default value is ve seconds. The minimum value is two seconds. This command is not
available in secure mode.
W Write the current setup to an esxtop (or resxtop) conguration le. This is the recommended way to write a
conguration le. The default lename is the one specied by -c option, or ~/.esxtop50rc if the -c option is
not used. You can also specify a dierent lename on the prompt generated by this W command.
q Quit the interactive mode.
c Switch to the CPU resource utilization panel.
p Switch to the CPU Power utilization panel.
m Switch to the memory resource utilization panel.
d Switch to the storage (disk) adapter resource utilization panel.
u Switch to storage (disk) device resource utilization screen.
v Switch to storage (disk) virtual machine resource utilization screen.
n Switch to the network resource utilization panel.
i Switch to the interrupt panel.
CPU Panel
The CPU panel displays server-wide statistics as well as statistics for the individual world, resource pool,
and virtual machine CPU utilization.
Resource pools, virtual machines that are running, or other worlds are at times called groups. For worlds
belonging to a virtual machine, statistics for the virtual machine that is running are displayed. All other
worlds are logically aggregated into the resource pools that contain them.
vSphere Monitoring and Performance
132 VMware, Inc.