
6.5.1


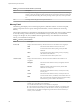

Table Of Contents
- vSphere Monitoring and Performance
- Contents
- About vSphere Monitoring and Performance
- Monitoring Inventory Objects with Performance Charts
- Performance Chart Types
- Data Counters
- Metric Groups in vSphere
- Data Collection Intervals
- Data Collection Levels
- View Performance Charts
- Performance Charts Options Available Under the View Menu
- Overview Performance Charts
- Clusters
- Data centers
- Datastores and Datastore Clusters
- Disk Space (Data Counters)
- Disk Space (File Types)
- Disk Space (Datastores)
- Disk Space (Virtual Machines)
- Storage I/O Control Normalized Latency
- Storage I/O Control Aggregate IOPs
- Storage I/O Control Activity
- Average Device Latency per Host
- Maximum Queue Depth per Host
- Read IOPs per Host
- Write IOPs Per Host
- Average Read Latency per Virtual Machine Disk
- Average Write Latency per Virtual Machine Disk
- Read IOPs per Virtual Machine Disk
- Write IOPs Per Virtual Machine Disk
- Virtual Machine Observed Latency per Datastore
- Hosts
- Resource Pools
- vApps
- Virtual Machines
- CPU (%)
- CPU Usage (MHz)
- Disk (Average)
- Disk (Rate)
- Disk (Number)
- Virtual Disk Requests (Number)
- Virtual Disk Rate (KBps)
- Memory (Usage)
- Memory (Balloon)
- Memory (Swap Rate)
- Memory (Data Counters)
- Network (Usage)
- Network (Rate)
- Network (Packets)
- Disk Space (Data Counters)
- Disk Space (Datastores)
- Disk Space (File Types)
- Fault Tolerance Performance Counters
- Working with Advanced and Custom Charts
- Troubleshoot and Enhance Performance
- Monitoring Guest Operating System Performance
- Monitoring Host Health Status
- Monitoring Events, Alarms, and Automated Actions
- View Events
- View System Logs
- Export Events Data
- Streaming Events to a Remote Syslog Server
- Retention of Events in the vCenter Server Database
- View Triggered Alarms and Alarm Definitions
- Live Refresh of Recent Tasks and Alarms
- Set an Alarm
- Acknowledge Triggered Alarms
- Reset Triggered Event Alarms
- Preconfigured vSphere Alarms
- Monitoring Solutions with the vCenter Solutions Manager
- Monitoring the Health of Services and Nodes
- Performance Monitoring Utilities: resxtop and esxtop
- Using the vimtop Plug-In to Monitor the Resource Use of Services
- Monitoring Networked Devices with SNMP and vSphere
- Using SNMP Traps with vCenter Server
- Configure SNMP for ESXi
- SNMP Diagnostics
- Monitor Guest Operating Systems with SNMP
- VMware MIB Files
- SNMPv2 Diagnostic Counters
- System Log Files
- View System Log Entries
- View System Logs on an ESXi Host
- System Logs
- Export System Log Files
- ESXi Log Files
- Upload Logs Package to a VMware Service Request
- Configure Syslog on ESXi Hosts
- Configuring Logging Levels for the Guest Operating System
- Collecting Log Files
- Viewing Log Files with the Log Browser
- Enable the Log Browser Plug-In on the vCenter Server Appliance
- Enable the Log Browser Plug-In on a vCenter Server Instance That Runs on Windows
- Retrieve Logs
- Search Log Files
- Filter Log Files
- Create Advanced Log Filters
- Adjust Log Times
- Export Logs from the Log Browser
- Compare Log Files
- Manage Logs Using the Log Browser
- Browse Log Files from Different Objects
- Index

Table 7‑2. Interactive Mode Command-Line Options (Continued)
Option Description
server The name of the remote server host to connect to (required for resxtop only).
vihost
If you connect indirectly (through vCenter Server), this option should contain the name of the
ESXi host you connect to. If you connect directly to the ESXi host, this option is not used.
Note that the host name needs to be the same as what is displayed in the vSphere Web Client.
portnumber
The port number to connect to on the remote server. The default port is 443, and unless this is
changed on the server, this option is not needed. (resxtop only)
username
The user name to be authenticated when connecting to the remote host. The remote server
prompts you for a password, as well (resxtop only).
a
Show all statistics. This option overrides conguration le setups and shows all statistics. The
conguration le can be the default ~/.esxtop50rc conguration le or a user-dened
conguration le.
c lename
Load a user-dened conguration le. If the -c option is not used, the default conguration
lename is ~/.esxtop50rc. Create your own conguration le, specifying a dierent lename,
using the W single-key interactive command.
Common Statistics Description
Several statistics appear on the dierent panels while resxtop (or esxtop) is running in interactive mode.
These statistics are common across all four panels.
The Uptime line, found at the top of each of the four resxtop (or esxtop) panels, displays the current time,
time since last reboot, number of currently running worlds and load averages. A world is an ESXi VMkernel
schedulable entity, similar to a process or thread in other operating systems.
Below that the load averages over the past one, ve, and fteen minutes appear. Load averages consider
both running and ready-to-run worlds. A load average of 1.00 means that there is full utilization of all
physical CPUs. A load average of 2.00 means that the ESXi system might need twice as many physical CPUs
as are currently available. Similarly, a load average of 0.50 means that the physical CPUs on the ESXi system
are half utilized.
Statistics Columns and Order Pages
You can dene the order of elds displayed in interactive mode.
If you press f, F, o, or O, the system displays a page that species the eld order on the top line and short
descriptions of the eld contents. If the leer in the eld string corresponding to a eld is uppercase, the
eld is displayed. An asterisk in front of the eld description indicates whether a eld is displayed.
The order of the elds corresponds to the order of the leers in the string.
From the Field Select panel, you can:
n
Toggle the display of a eld by pressing the corresponding leer.
n
Move a eld to the left by pressing the corresponding uppercase leer.
n
Move a eld to the right by pressing the corresponding lowercase leer.
Interactive Mode Single-Key Commands
When running in interactive mode, resxtop (or esxtop) recognizes several single-key commands.
All interactive mode panels recognize the commands listed in the following table. The command to specify
the delay between updates is disabled if the s option is given on the command line. All sorting interactive
commands sort in descending order.
Chapter 7 Performance Monitoring Utilities: resxtop and esxtop
VMware, Inc. 131