
6.5.1

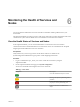


Table Of Contents
- vSphere Monitoring and Performance
- Contents
- About vSphere Monitoring and Performance
- Monitoring Inventory Objects with Performance Charts
- Performance Chart Types
- Data Counters
- Metric Groups in vSphere
- Data Collection Intervals
- Data Collection Levels
- View Performance Charts
- Performance Charts Options Available Under the View Menu
- Overview Performance Charts
- Clusters
- Data centers
- Datastores and Datastore Clusters
- Disk Space (Data Counters)
- Disk Space (File Types)
- Disk Space (Datastores)
- Disk Space (Virtual Machines)
- Storage I/O Control Normalized Latency
- Storage I/O Control Aggregate IOPs
- Storage I/O Control Activity
- Average Device Latency per Host
- Maximum Queue Depth per Host
- Read IOPs per Host
- Write IOPs Per Host
- Average Read Latency per Virtual Machine Disk
- Average Write Latency per Virtual Machine Disk
- Read IOPs per Virtual Machine Disk
- Write IOPs Per Virtual Machine Disk
- Virtual Machine Observed Latency per Datastore
- Hosts
- Resource Pools
- vApps
- Virtual Machines
- CPU (%)
- CPU Usage (MHz)
- Disk (Average)
- Disk (Rate)
- Disk (Number)
- Virtual Disk Requests (Number)
- Virtual Disk Rate (KBps)
- Memory (Usage)
- Memory (Balloon)
- Memory (Swap Rate)
- Memory (Data Counters)
- Network (Usage)
- Network (Rate)
- Network (Packets)
- Disk Space (Data Counters)
- Disk Space (Datastores)
- Disk Space (File Types)
- Fault Tolerance Performance Counters
- Working with Advanced and Custom Charts
- Troubleshoot and Enhance Performance
- Monitoring Guest Operating System Performance
- Monitoring Host Health Status
- Monitoring Events, Alarms, and Automated Actions
- View Events
- View System Logs
- Export Events Data
- Streaming Events to a Remote Syslog Server
- Retention of Events in the vCenter Server Database
- View Triggered Alarms and Alarm Definitions
- Live Refresh of Recent Tasks and Alarms
- Set an Alarm
- Acknowledge Triggered Alarms
- Reset Triggered Event Alarms
- Preconfigured vSphere Alarms
- Monitoring Solutions with the vCenter Solutions Manager
- Monitoring the Health of Services and Nodes
- Performance Monitoring Utilities: resxtop and esxtop
- Using the vimtop Plug-In to Monitor the Resource Use of Services
- Monitoring Networked Devices with SNMP and vSphere
- Using SNMP Traps with vCenter Server
- Configure SNMP for ESXi
- SNMP Diagnostics
- Monitor Guest Operating Systems with SNMP
- VMware MIB Files
- SNMPv2 Diagnostic Counters
- System Log Files
- View System Log Entries
- View System Logs on an ESXi Host
- System Logs
- Export System Log Files
- ESXi Log Files
- Upload Logs Package to a VMware Service Request
- Configure Syslog on ESXi Hosts
- Configuring Logging Levels for the Guest Operating System
- Collecting Log Files
- Viewing Log Files with the Log Browser
- Enable the Log Browser Plug-In on the vCenter Server Appliance
- Enable the Log Browser Plug-In on a vCenter Server Instance That Runs on Windows
- Retrieve Logs
- Search Log Files
- Filter Log Files
- Create Advanced Log Filters
- Adjust Log Times
- Export Logs from the Log Browser
- Compare Log Files
- Manage Logs Using the Log Browser
- Browse Log Files from Different Objects
- Index

4 Select a solution.
The Summary tab displays more information about the solution.
5 To view vService provider information, click Monitor, and click vServices.
Monitoring Agents
The vCenter Solutions Manager displays the vSphere ESX Agent Manager agents that you use to deploy and
manage related agents on ESX/ESXi hosts.
You can use the Solutions Manager to keep track of whether the agents of a solution are working as
expected. Outstanding issues are reected by the solution's ESX Agent Manager status and a list of issues.
When the status of a solution changes, the Solutions Manager updates the ESX Agent Manager summary
status and state. Administrators use this status to track whether the goal state is reached.
The agent health status is indicated by a specic color.
Table 5‑1. ESX Agent Manager health status
Status Description
Red The solution must intervene for the ESX Agent Manager to
proceed. For example, if a virtual machine agent is
powered o manually on a compute resource and the ESX
Agent Manager does not aempt to power on the agent.
The ESX Agent Manager reports this action to the solution,
and the solution alerts the administrator to power on the
agent.
Yellow The ESX Agent Manager is actively working to reach a goal
state. The goal state can be enabled, disabled, or
uninstalled. For example, when a solution is registered, its
status is yellow until the ESX Agent Manager deploys the
solutions agents to all the specied compute resources. A
solution does not need to intervene when the ESX Agent
Manager reports its ESX Agent Manager health status as
yellow.
Green A solution and all its agents have reached the goal state.
Monitoring vServices
A vService is a service or function that a solution provides to virtual machines and vApps. A solution can
provide one or more vServices. These vServices integrate with the platform and are able to change the
environment in which the vApp or virtual machine runs.
A vService is a type of service for a virtual machine and a vApp provided by a vCenter extension. Virtual
machines and vApps can have dependencies on vServices. Each dependency is associated with a vService
type. The vService type must be bound to a particular vCenter extension that implements that vService type.
This vService type is similar to a virtual hardware device. For example, a virtual machine can have a
networking device that at deployment must be connected to a particular network.
The vService Manager allows a solution to connect to operations related to OVF templates:
n
Importing OVF templates. Receive a callback when OVF templates with a vService dependency of a
certain type are imported.
n
Exporting OVF templates. Inserts OVF sections when a virtual machine is exported.
n
OVF environment generation. Inserts OVF sections into the OVF environment at the power-on instance.
The vServices tab in the Solution Manager provides details for each vCenter extension. This information
allows you to monitor vService providers and list the virtual machines or vApps to which they are bound.
vSphere Monitoring and Performance
126 VMware, Inc.