
6.5.1
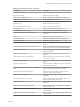
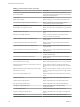


Table Of Contents
- vSphere Monitoring and Performance
- Contents
- About vSphere Monitoring and Performance
- Monitoring Inventory Objects with Performance Charts
- Performance Chart Types
- Data Counters
- Metric Groups in vSphere
- Data Collection Intervals
- Data Collection Levels
- View Performance Charts
- Performance Charts Options Available Under the View Menu
- Overview Performance Charts
- Clusters
- Data centers
- Datastores and Datastore Clusters
- Disk Space (Data Counters)
- Disk Space (File Types)
- Disk Space (Datastores)
- Disk Space (Virtual Machines)
- Storage I/O Control Normalized Latency
- Storage I/O Control Aggregate IOPs
- Storage I/O Control Activity
- Average Device Latency per Host
- Maximum Queue Depth per Host
- Read IOPs per Host
- Write IOPs Per Host
- Average Read Latency per Virtual Machine Disk
- Average Write Latency per Virtual Machine Disk
- Read IOPs per Virtual Machine Disk
- Write IOPs Per Virtual Machine Disk
- Virtual Machine Observed Latency per Datastore
- Hosts
- Resource Pools
- vApps
- Virtual Machines
- CPU (%)
- CPU Usage (MHz)
- Disk (Average)
- Disk (Rate)
- Disk (Number)
- Virtual Disk Requests (Number)
- Virtual Disk Rate (KBps)
- Memory (Usage)
- Memory (Balloon)
- Memory (Swap Rate)
- Memory (Data Counters)
- Network (Usage)
- Network (Rate)
- Network (Packets)
- Disk Space (Data Counters)
- Disk Space (Datastores)
- Disk Space (File Types)
- Fault Tolerance Performance Counters
- Working with Advanced and Custom Charts
- Troubleshoot and Enhance Performance
- Monitoring Guest Operating System Performance
- Monitoring Host Health Status
- Monitoring Events, Alarms, and Automated Actions
- View Events
- View System Logs
- Export Events Data
- Streaming Events to a Remote Syslog Server
- Retention of Events in the vCenter Server Database
- View Triggered Alarms and Alarm Definitions
- Live Refresh of Recent Tasks and Alarms
- Set an Alarm
- Acknowledge Triggered Alarms
- Reset Triggered Event Alarms
- Preconfigured vSphere Alarms
- Monitoring Solutions with the vCenter Solutions Manager
- Monitoring the Health of Services and Nodes
- Performance Monitoring Utilities: resxtop and esxtop
- Using the vimtop Plug-In to Monitor the Resource Use of Services
- Monitoring Networked Devices with SNMP and vSphere
- Using SNMP Traps with vCenter Server
- Configure SNMP for ESXi
- SNMP Diagnostics
- Monitor Guest Operating Systems with SNMP
- VMware MIB Files
- SNMPv2 Diagnostic Counters
- System Log Files
- View System Log Entries
- View System Logs on an ESXi Host
- System Logs
- Export System Log Files
- ESXi Log Files
- Upload Logs Package to a VMware Service Request
- Configure Syslog on ESXi Hosts
- Configuring Logging Levels for the Guest Operating System
- Collecting Log Files
- Viewing Log Files with the Log Browser
- Enable the Log Browser Plug-In on the vCenter Server Appliance
- Enable the Log Browser Plug-In on a vCenter Server Instance That Runs on Windows
- Retrieve Logs
- Search Log Files
- Filter Log Files
- Create Advanced Log Filters
- Adjust Log Times
- Export Logs from the Log Browser
- Compare Log Files
- Manage Logs Using the Log Browser
- Browse Log Files from Different Objects
- Index

Table 4‑6. Default vSphere Alarms (Continued)
Alarm Name Description
vCenter Server Health Alarm Monitors the health status of vCenter Server.
Database Health Alarm Monitors the database health status.
When database space reaches 80%, vCenter Server displays
a warning event.
When database space reaches 95%, vCenter Server displays
an error event and shuts down. You can clean up the
database, or increase database storage capacity, and start
vCenter Server.
The alarm is triggered only for PostgreSQL and Microsoft
SQL Server database health issues, and does not work with
Oracle databases.
Data Service Health Alarm Monitors the health status of the Data Service.
RBD Health Alarm Monitors the health status of the vSphere Auto Deploy
Waiter.
vService Manager Health Alarm Monitors the health status of the vService Manager.
Performance Charts Service Health Alarm Monitors the health status of the Performance Charts
Service.
Content Library Service Health Alarm Monitors the health status of the VMware Content Library
Service.
Transfer Service Health Alarm Monitors the health status of the VMware Transfer Service.
VMware vSphere ESXi Dump Collector Health Alarm Monitors the health status of the VMware vSphere ESXi
Dump Collector Service.
VMware vAPI Endpoint Service Health Alarm Monitors the health status of the VMware vAPI Endpoint
Service.
VMware System and Hardware Health Manager Service
Health Alarm
Monitors the health status of the VMware System and
Hardware Health Manager Service.
VMware vSphere Prole-Driven Storage Service Health
Alarm
Monitors the health status of the VMware vSphere Prole-
Driven Storage Service.
VMware Common Logging Service Health Alarm Monitors the health status of the VMware Common
Logging Service.
VMware vFabric Postgres Service Health Alarm Monitors the health status of the VMware vFabric Postgres
Service.
ESXi Host Certicates Update Failure Status Monitors whether the update of the ESXi host certicates
failed.
ESXi Host Certicate Status Monitors the certicate status of an ESXi host.
ESXi Host Certicate Verication Failure Status Monitors whether the verication of an ESXi host certicate
failed.
vSphere vCenter Host Certicate Management Mode Monitors changes in the certicate management mode of
vCenter Server.
Root Certicate Status Monitors whether a root certicate is geing close to its
expiration date.
GPU ECC Uncorrected Memory Alarm Monitors the GPU ECC uncorrected memory status.
GPU ECC Corrected Memory Alarm Monitors the GPU ECC corrected memory status.
GPU Thermal Condition Alarm Monitors the GPU Thermal condition status.
Network connectivity lost Monitors the network connectivity on a virtual switch.
Network uplink redundancy lost Monitors network uplink redundancy on a virtual switch.
Chapter 4 Monitoring Events, Alarms, and Automated Actions
VMware, Inc. 123