
6.5.1
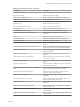
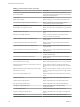
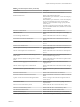


Table Of Contents
- vSphere Monitoring and Performance
- Contents
- About vSphere Monitoring and Performance
- Monitoring Inventory Objects with Performance Charts
- Performance Chart Types
- Data Counters
- Metric Groups in vSphere
- Data Collection Intervals
- Data Collection Levels
- View Performance Charts
- Performance Charts Options Available Under the View Menu
- Overview Performance Charts
- Clusters
- Data centers
- Datastores and Datastore Clusters
- Disk Space (Data Counters)
- Disk Space (File Types)
- Disk Space (Datastores)
- Disk Space (Virtual Machines)
- Storage I/O Control Normalized Latency
- Storage I/O Control Aggregate IOPs
- Storage I/O Control Activity
- Average Device Latency per Host
- Maximum Queue Depth per Host
- Read IOPs per Host
- Write IOPs Per Host
- Average Read Latency per Virtual Machine Disk
- Average Write Latency per Virtual Machine Disk
- Read IOPs per Virtual Machine Disk
- Write IOPs Per Virtual Machine Disk
- Virtual Machine Observed Latency per Datastore
- Hosts
- Resource Pools
- vApps
- Virtual Machines
- CPU (%)
- CPU Usage (MHz)
- Disk (Average)
- Disk (Rate)
- Disk (Number)
- Virtual Disk Requests (Number)
- Virtual Disk Rate (KBps)
- Memory (Usage)
- Memory (Balloon)
- Memory (Swap Rate)
- Memory (Data Counters)
- Network (Usage)
- Network (Rate)
- Network (Packets)
- Disk Space (Data Counters)
- Disk Space (Datastores)
- Disk Space (File Types)
- Fault Tolerance Performance Counters
- Working with Advanced and Custom Charts
- Troubleshoot and Enhance Performance
- Monitoring Guest Operating System Performance
- Monitoring Host Health Status
- Monitoring Events, Alarms, and Automated Actions
- View Events
- View System Logs
- Export Events Data
- Streaming Events to a Remote Syslog Server
- Retention of Events in the vCenter Server Database
- View Triggered Alarms and Alarm Definitions
- Live Refresh of Recent Tasks and Alarms
- Set an Alarm
- Acknowledge Triggered Alarms
- Reset Triggered Event Alarms
- Preconfigured vSphere Alarms
- Monitoring Solutions with the vCenter Solutions Manager
- Monitoring the Health of Services and Nodes
- Performance Monitoring Utilities: resxtop and esxtop
- Using the vimtop Plug-In to Monitor the Resource Use of Services
- Monitoring Networked Devices with SNMP and vSphere
- Using SNMP Traps with vCenter Server
- Configure SNMP for ESXi
- SNMP Diagnostics
- Monitor Guest Operating Systems with SNMP
- VMware MIB Files
- SNMPv2 Diagnostic Counters
- System Log Files
- View System Log Entries
- View System Logs on an ESXi Host
- System Logs
- Export System Log Files
- ESXi Log Files
- Upload Logs Package to a VMware Service Request
- Configure Syslog on ESXi Hosts
- Configuring Logging Levels for the Guest Operating System
- Collecting Log Files
- Viewing Log Files with the Log Browser
- Enable the Log Browser Plug-In on the vCenter Server Appliance
- Enable the Log Browser Plug-In on a vCenter Server Instance That Runs on Windows
- Retrieve Logs
- Search Log Files
- Filter Log Files
- Create Advanced Log Filters
- Adjust Log Times
- Export Logs from the Log Browser
- Compare Log Files
- Manage Logs Using the Log Browser
- Browse Log Files from Different Objects
- Index

Table 4‑6. Default vSphere Alarms (Continued)
Alarm Name Description
Host hardware fan status Monitors host fans.
Host hardware voltage Monitors host hardware voltage.
Host hardware temperature status Monitors the temperature status of the host hardware.
Host hardware power status Monitors the host power status.
Host hardware system board status Monitors the status of host system boards.
Host baery status Monitors the baery status of hosts.
Status of other host hardware objects Monitors other host hardware objects.
Host storage status Monitors host connectivity to storage devices.
Host IPMI System Event Log status Monitors the capacity of the IPMI system event log.
Host Baseboard Management Controller status Monitors the status of the Baseboard Management
Controller.
Host error * Monitors host error and warning events.
Virtual machine error * Monitors virtual machine error and warning events.
Host connection failure * Monitors host connection failures.
Unmanaged workload detected on SIOC-enabled datastore Monitors the unmanaged I/O workload on a SIOC-enabled
datastore.
Thin-provisioned volume capacity threshold exceeded Monitors whether the thin provisioning threshold on the
storage array exceeds for volumes backing the datastore.
Datastore capability alarm Monitors the change in the capability status for volumes
backing the datastore.
VASA provider disconnected Monitors the changes in the connection state of VASA
providers.
VASA Provider certicate expiration alarm Monitors whether VASA provider certicates are geing
close to their expiry date.
VM storage compliance alarm Monitors the virtual disk compliance with the object-based
storage.
Datastore compliance alarm Monitors wether the virtual disk on the datastore complies
with the object-based storage.
Refreshing CA certicates and CRLs for a VASA provider
failed
Monitors whether the refreshing of CA certicates and
CRLs for some of the VASA providers has failed.
Insucient vSphere HA failover resources Monitors the suciency of failover cluster resources
required for vSphere High Availability.
vSphere HA failover in progress Monitors the failover progress of vSphere High
Availability.
Cannot nd vSphere HA master agent Monitors whether vCenter Server is able to connect to a
vSphere High Availability master agent.
vSphere HA host status Monitors the host health status reported by vSphere High
Availability.
vSphere HA virtual machine failover failed Monitors whether a failover operation that uses vSphere
High Availability failed.
vSphere HA virtual machine monitoring action Monitors whether vSphere High Availability has restarted
a virtual machine.
vSphere HA virtual machine monitoring error Monitors whether vSphere High Availability failed to reset
a virtual machine.
Chapter 4 Monitoring Events, Alarms, and Automated Actions
VMware, Inc. 121