
6.5.1

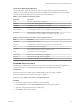


Table Of Contents
- vSphere Monitoring and Performance
- Contents
- About vSphere Monitoring and Performance
- Monitoring Inventory Objects with Performance Charts
- Performance Chart Types
- Data Counters
- Metric Groups in vSphere
- Data Collection Intervals
- Data Collection Levels
- View Performance Charts
- Performance Charts Options Available Under the View Menu
- Overview Performance Charts
- Clusters
- Data centers
- Datastores and Datastore Clusters
- Disk Space (Data Counters)
- Disk Space (File Types)
- Disk Space (Datastores)
- Disk Space (Virtual Machines)
- Storage I/O Control Normalized Latency
- Storage I/O Control Aggregate IOPs
- Storage I/O Control Activity
- Average Device Latency per Host
- Maximum Queue Depth per Host
- Read IOPs per Host
- Write IOPs Per Host
- Average Read Latency per Virtual Machine Disk
- Average Write Latency per Virtual Machine Disk
- Read IOPs per Virtual Machine Disk
- Write IOPs Per Virtual Machine Disk
- Virtual Machine Observed Latency per Datastore
- Hosts
- Resource Pools
- vApps
- Virtual Machines
- CPU (%)
- CPU Usage (MHz)
- Disk (Average)
- Disk (Rate)
- Disk (Number)
- Virtual Disk Requests (Number)
- Virtual Disk Rate (KBps)
- Memory (Usage)
- Memory (Balloon)
- Memory (Swap Rate)
- Memory (Data Counters)
- Network (Usage)
- Network (Rate)
- Network (Packets)
- Disk Space (Data Counters)
- Disk Space (Datastores)
- Disk Space (File Types)
- Fault Tolerance Performance Counters
- Working with Advanced and Custom Charts
- Troubleshoot and Enhance Performance
- Monitoring Guest Operating System Performance
- Monitoring Host Health Status
- Monitoring Events, Alarms, and Automated Actions
- View Events
- View System Logs
- Export Events Data
- Streaming Events to a Remote Syslog Server
- Retention of Events in the vCenter Server Database
- View Triggered Alarms and Alarm Definitions
- Live Refresh of Recent Tasks and Alarms
- Set an Alarm
- Acknowledge Triggered Alarms
- Reset Triggered Event Alarms
- Preconfigured vSphere Alarms
- Monitoring Solutions with the vCenter Solutions Manager
- Monitoring the Health of Services and Nodes
- Performance Monitoring Utilities: resxtop and esxtop
- Using the vimtop Plug-In to Monitor the Resource Use of Services
- Monitoring Networked Devices with SNMP and vSphere
- Using SNMP Traps with vCenter Server
- Configure SNMP for ESXi
- SNMP Diagnostics
- Monitor Guest Operating Systems with SNMP
- VMware MIB Files
- SNMPv2 Diagnostic Counters
- System Log Files
- View System Log Entries
- View System Logs on an ESXi Host
- System Logs
- Export System Log Files
- ESXi Log Files
- Upload Logs Package to a VMware Service Request
- Configure Syslog on ESXi Hosts
- Configuring Logging Levels for the Guest Operating System
- Collecting Log Files
- Viewing Log Files with the Log Browser
- Enable the Log Browser Plug-In on the vCenter Server Appliance
- Enable the Log Browser Plug-In on a vCenter Server Instance That Runs on Windows
- Retrieve Logs
- Search Log Files
- Filter Log Files
- Create Advanced Log Filters
- Adjust Log Times
- Export Logs from the Log Browser
- Compare Log Files
- Manage Logs Using the Log Browser
- Browse Log Files from Different Objects
- Index

Preconfigured vSphere Alarms
vCenter Server provides a list of default alarms, which monitor the operations of vSphere inventory objects.
You must only set up actions for these alarms.
Some alarms are stateless. vCenter Server does not keep data on stateless alarms, does not compute, or
display their status. Stateless alarms cannot be acknowledged or reset. Stateless alarms are indicated by an
asterisk next to their name.
Table 4‑6. Default vSphere Alarms
Alarm Name Description
Host connection and power state Monitors the power state of the host and whether the host
is reachable.
Host CPU usage Monitors host CPU usage.
Host memory usage Monitors host memory usage.
Virtual machine CPU usage Monitors virtual machine CPU usage.
Virtual machine memory usage Monitors virtual machine memory usage.
Datastore usage on disk Monitors datastore disk usage.
N This alarm controls the Status value for datastores
in vSphere Web Client. If you disable this alarm, the
datastore status is displayed as Unknown.
Virtual machine CPU ready Monitors virtual machine CPU ready time.
Virtual machine total disk latency Monitors virtual machine total disk latency.
Virtual machine disk commands canceled Monitors the number of virtual machine disk commands
that are canceled.
Virtual machine disk reset Monitors the number of virtual machine bus resets.
License inventory monitoring Monitors the license inventory for compliance.
License user threshold monitoring Monitors whether a user-dened license threshold is
exceeded.
License capacity monitoring Monitors whether a license capacity is exceeded.
The host license edition is not compatible with the
vCenter Server license edition
Monitors the compatibility of the vCenter Server and host
license editions.
Host ash capacity exceeds the licensed limit for vSAN Monitors whether the ash disk capacity on the host
exceeds the limit of the vSAN license.
Expired vSAN license Monitors the expiry of the vSAN license and the end of the
evaluation period.
Errors occurred on the disk(s) of a vSAN host Default alarm that monitors whether the host disks in the
vSAN cluster have errors.
Timed out starting Secondary VM * Monitors whether starting a secondary virtual machine has
timed out.
No compatible host for Secondary VM Monitors the availability of compatible hosts on which a
secondary virtual machine can be created and run.
Virtual machine Fault Tolerance state changed Monitors changes in the Fault Tolerance state of a virtual
machine.
Virtual Machine Fault Tolerance vLockStep interval Status
Changed
Monitors changes in the Fault Tolerance Secondary
vLockStep interval.
Host processor status Monitors the host processors.
Host memory status Monitors host memory usage.
vSphere Monitoring and Performance
120 VMware, Inc.