
6.5.1

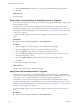
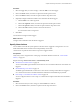
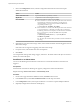
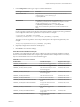


Table Of Contents
- vSphere Monitoring and Performance
- Contents
- About vSphere Monitoring and Performance
- Monitoring Inventory Objects with Performance Charts
- Performance Chart Types
- Data Counters
- Metric Groups in vSphere
- Data Collection Intervals
- Data Collection Levels
- View Performance Charts
- Performance Charts Options Available Under the View Menu
- Overview Performance Charts
- Clusters
- Data centers
- Datastores and Datastore Clusters
- Disk Space (Data Counters)
- Disk Space (File Types)
- Disk Space (Datastores)
- Disk Space (Virtual Machines)
- Storage I/O Control Normalized Latency
- Storage I/O Control Aggregate IOPs
- Storage I/O Control Activity
- Average Device Latency per Host
- Maximum Queue Depth per Host
- Read IOPs per Host
- Write IOPs Per Host
- Average Read Latency per Virtual Machine Disk
- Average Write Latency per Virtual Machine Disk
- Read IOPs per Virtual Machine Disk
- Write IOPs Per Virtual Machine Disk
- Virtual Machine Observed Latency per Datastore
- Hosts
- Resource Pools
- vApps
- Virtual Machines
- CPU (%)
- CPU Usage (MHz)
- Disk (Average)
- Disk (Rate)
- Disk (Number)
- Virtual Disk Requests (Number)
- Virtual Disk Rate (KBps)
- Memory (Usage)
- Memory (Balloon)
- Memory (Swap Rate)
- Memory (Data Counters)
- Network (Usage)
- Network (Rate)
- Network (Packets)
- Disk Space (Data Counters)
- Disk Space (Datastores)
- Disk Space (File Types)
- Fault Tolerance Performance Counters
- Working with Advanced and Custom Charts
- Troubleshoot and Enhance Performance
- Monitoring Guest Operating System Performance
- Monitoring Host Health Status
- Monitoring Events, Alarms, and Automated Actions
- View Events
- View System Logs
- Export Events Data
- Streaming Events to a Remote Syslog Server
- Retention of Events in the vCenter Server Database
- View Triggered Alarms and Alarm Definitions
- Live Refresh of Recent Tasks and Alarms
- Set an Alarm
- Acknowledge Triggered Alarms
- Reset Triggered Event Alarms
- Preconfigured vSphere Alarms
- Monitoring Solutions with the vCenter Solutions Manager
- Monitoring the Health of Services and Nodes
- Performance Monitoring Utilities: resxtop and esxtop
- Using the vimtop Plug-In to Monitor the Resource Use of Services
- Monitoring Networked Devices with SNMP and vSphere
- Using SNMP Traps with vCenter Server
- Configure SNMP for ESXi
- SNMP Diagnostics
- Monitor Guest Operating Systems with SNMP
- VMware MIB Files
- SNMPv2 Diagnostic Counters
- System Log Files
- View System Log Entries
- View System Logs on an ESXi Host
- System Logs
- Export System Log Files
- ESXi Log Files
- Upload Logs Package to a VMware Service Request
- Configure Syslog on ESXi Hosts
- Configuring Logging Levels for the Guest Operating System
- Collecting Log Files
- Viewing Log Files with the Log Browser
- Enable the Log Browser Plug-In on the vCenter Server Appliance
- Enable the Log Browser Plug-In on a vCenter Server Instance That Runs on Windows
- Retrieve Logs
- Search Log Files
- Filter Log Files
- Create Advanced Log Filters
- Adjust Log Times
- Export Logs from the Log Browser
- Compare Log Files
- Manage Logs Using the Log Browser
- Browse Log Files from Different Objects
- Index

3 In the column, type script or command information:
For this type of command... Enter this...
EXE executable files
Full pathname of the command. For example, to run the cmd.exe
command in the C:\tools directory, type:
c:\tools\cmd.exe.
BAT batch file
Full pathname of the command as an argument to the
c:\windows\system32\cmd.exe command. For example, to run the
cmd.bat command in the C:\tools directory, type:
c:\windows\system32\cmd.exe /c c:\tools\cmd.bat.
N The command and its parameters must be formaed into one
string.
If your script does not make use of the alarm environment variables, include any necessary parameters
in the conguration eld. Enclose parameters in curly brackets. For example:
c:\tools\cmd.exe {alarmName} {targetName}
c:\windows\system32\cmd.exe /c c:\tools\cmd.bat {alarmName} {targetName}
The script can run on any platform. You must provide the path to the script and argument keys. For
example:
/var/myscripts/myAlarmActionScript {alarmName} {targetName}
4 (Optional) Congure alarm transitions and frequency.
5 Click Finish to save the alarm seings.
Alarm Environment Variables for Scripts
To simplify script conguration for alarm actions, VMware provides environment variables for VMware
alarms. Use the variables to dene more complex scripts and aach them to multiple alarms or inventory
objects so that the alarm action occurs when the alarm triggers.
Table 4‑4. Alarm Environment Variables
Variable Name Variable Description Supported Alarm Type
VMWARE_ALARM_NAME The name of the triggered alarm. Condition, State, Event
VMWARE_ALARM_ID The MOID of the triggered alarm. Condition, State, Event
VMWARE_ALARM_TARGET_NAME The name of the entity on which
the alarm triggered.
Condition, State, Event
VMWARE_ALARM_TARGET_ID The MOID of the entity on which
the alarm triggered.
Condition, State, Event
VMWARE_ALARM_OLDSTATUS The old status of the alarm. Condition, State, Event
VMWARE_ALARM_NEWSTATUS The new status of the alarm. Condition, State, Event
VMWARE_ALARM_TRIGGERINGSUMMARY A multiline summary of the
alarm.
Condition, State, Event
VMWARE_ALARM_DECLARINGSUMMARY A single-line declaration of the
alarm expression.
Condition, State, Event
VMWARE_ALARM_ALARMVALUE The value that triggered the
alarm.
Condition, State
VMWARE_ALARM_EVENTDESCRIPTION A description of the alarm status
change event.
Condition, State
VMWARE_ALARM_EVENTDESCRIPTION A description of the event that
triggered the alarm.
Event
Chapter 4 Monitoring Events, Alarms, and Automated Actions
VMware, Inc. 117