
6.5.1
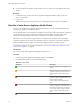


Table Of Contents
- vCenter Server Appliance Configuration
- Contents
- About vCenter Server Appliance Configuration
- Updated Information
- vCenter Server Appliance Overview
- Using the Appliance Management Interface to Configure the vCenter Server Appliance
- Log In to the vCenter Server Appliance Management Interface
- View the vCenter Server Appliance Health Status
- Reboot or Shut Down the vCenter Server Appliance
- Export a Support Bundle
- Enable or Disable SSH and Bash Shell Access
- Configure the DNS, IP Address, and Proxy Settings
- Configure the System Time Zone and Time Synchronization Settings
- Change the Password and Password Expiration Settings of the Root User
- Redirect vCenter Server Appliance Log Files to Another Machine
- Monitor Network Use
- Monitor CPU and Memory Use
- Monitor Database Use
- Using the vSphere Web Client to Configure the vCenter Server Appliance
- Join the vCenter Server Appliance to an Active Directory Domain
- Leave an Active Directory Domain
- Add a User to the SystemConfiguration.BashShellAdministrators Group
- Edit Access Settings to the vCenter Server Appliance
- Edit the DNS and IP Address Settings of the vCenter Server Appliance
- Edit the Firewall Settings of the vCenter Server Appliance
- Edit the Startup Settings of a Service
- Start, Stop, or Restart Services in the vCenter Server Appliance
- View the Health Status of Services and Nodes
- Edit the Settings of Services
- Export a Support Bundle
- Using the Appliance Shell to Configure the vCenter Server Appliance
- Access the Appliance Shell
- Enable and Access the Bash Shell from the Appliance Shell
- Keyboard Shortcuts for Editing Commands
- Get Help About the Plug-Ins and API Commands in the Appliance
- Plug-Ins in the vCenter Server Appliance Shell
- Browse the Log Files By Using the showlog Plug-In
- API Commands in the vCenter Server Appliance Shell
- Configuring SNMP for the vCenter Server Appliance
- Configuring Time Synchronization Settings in the vCenter Server Appliance
- Managing Local User Accounts in the vCenter Server Appliance
- User Roles in the vCenter Server Appliance
- Get a List of the Local User Accounts in the vCenter Server Appliance
- Create a Local User Account in the vCenter Server Appliance
- Update the Password of a Local User in the vCenter Server Appliance
- Update a Local User Account in the vCenter Server Appliance
- Delete a Local User Account in the vCenter Server Appliance
- Monitor Health Status and Statistics in the vCenter Server Appliance
- Using the vimtop Plug-In to Monitor the Resource Use of Services
- Using the Direct Console User Interface to Configure the vCenter Server Appliance
- Log In to the Direct Console User Interface
- Change the Password of the Root User
- Configure the Management Network of the vCenter Server Appliance
- Restart the Management Network of the vCenter Server Appliance
- Enable Access to the Appliance Bash Shell
- Access the Appliance Bash Shell for Troubleshooting
- Export a vCenter Server Support Bundle for Troubleshooting
- Index

3 From the table below the graph grid, select a packet or transmit byte rate to monitor.
The options vary depending on your network seings.
The network utilization graph refreshes to display the use of the item you select.
4 Point to the network utilization graph to see the network use data for a particular date and time.
Monitor CPU and Memory Use
You can use the vCenter Server Appliance Management Interface to monitor the overall CPU and memory
use of the vCenter Server Appliance.
Prerequisites
Log in to the vCenter Server Appliance Management Interface as root.
Procedure
1 In the vCenter Server Appliance Management Interface, click CPU and Memory.
2 From the Overall CPU Utilization Trending drop-down menu, select the time period for which you
want to generate a CPU utilization trending graph.
3 Point to the CPU graph to see the CPU use for a particular date and time.
4 From the Overall Memory Utilization Trending drop-down menu, select the time period for which
you want to generate a memory utilization trending graph.
5 Point to the memory graph to see the memory use for a particular date and time.
Monitor Database Use
You can use the vCenter Server Appliance Management Interface to monitor the use of the embedded
database of the vCenter Server Appliance by data type. You can also monitor space use trending graphs and
lter any of the largest data types.
Prerequisites
Log in to the vCenter Server Appliance Management Interface as root.
Procedure
1 In the vCenter Server Appliance Management Interface, click Database.
2 In the Current Utilization pane, you can monitor the consumed and free space for the
vCenter Server Appliance database.
Data File System Description
VC DB SEAT Stats, events, alarms, and tasks data that is generated for the hosts and virtual machines
managed by the vCenter Server instance running in the vCenter Server Appliance.
Transaction Log Internal database transaction logging data that is used for recovery from failures and other
purposes.
VC Inventory Inventory data that describes the hosts and virtual machines managed by the vCenter Server
instance running in the vCenter Server Appliance.
3 From the Overall current space utilization trending drop-down menu, select the time period for which
you want to generate the space utilization trending graphs.
4 Click the colored radio buon of a particular database component to include or exclude that component
from the graph.
vCenter Server Appliance Configuration
18 VMware, Inc.