
6.4
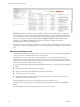
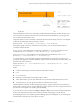
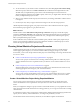
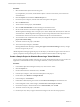
Table Of Contents
- vRealize Operations Manager User Guide
- Contents
- About This User Guide
- Monitoring Objects in Your Managed Environment
- What to Do When...
- User Scenario: A User Calls With a Problem
- User Scenario: An Alert Arrives in Your Inbox
- Respond to an Alert in Your Email
- Evaluate Other Triggered Symptoms for the Affected Data Store
- Compare Alerts and Events Over Time in Response to a Datastore Alert
- View the Affected Datastore in Relation to Other Objects
- Construct Metric Charts to Investigate the Cause of the Data Store Alert
- Run a Recommendation On a Datastore to Resolve an Alert
- User Scenario: You See Problems as You Monitor the State of Your Objects
- Monitoring and Responding to Alerts
- Monitoring and Responding to Problems
- Evaluating Object Summary Information
- Investigating Object Alerts
- Evaluating Metric Information
- Analyzing the Resources in Your Environment
- Using Troubleshooting Tools to Resolve Problems
- Creating and Using Object Details
- Examining Relationships in Your Environment
- User Scenario: Investigate the Root Cause a Problem Using Troubleshooting Tab Options
- Running Actions from vRealize Operations Manager
- List of vRealize Operations Manager Actions
- Working With Actions That Use Power Off Allowed
- Actions Supported for Automation
- Integration of Actions with vRealize Automation
- Run Actions From Toolbars in vRealize Operations Manager
- Troubleshoot Actions in vRealize Operations Manager
- Monitor Recent Task Status
- Troubleshoot Failed Tasks
- Determine If a Recent Task Failed
- Troubleshooting Maximum Time Reached Task Status
- Troubleshooting Set CPU or Set Memory Failed Tasks
- Troubleshooting Set CPU Count or Set Memory with Powered Off Allowed
- Troubleshooting Set CPU Count and Memory When Values Not Supported
- Troubleshooting Set CPU Resources or Set Memory Resources When the Value is Not Supported
- Troubleshooting Set CPU Resources or Set Memory Resources When the Value is Too High
- Troubleshooting Set Memory Resources When the Value is Not Evenly Divisible by 1024
- Troubleshooting Failed Shut Down VM Action Status
- Troubleshooting VMware Tools Not Running for a Shut Down VM Action Status
- Troubleshooting Failed Delete Unused Snapshots Action Status
- Viewing Your Inventory
- What to Do When...
- Planning the Capacity for Your Managed Environment
- Index

Demand Exceeds is a percentage of capacity. Capacity is also called provisioned capacity. To change the
stress threshold for a resource, double-click the Demand Exceeds percentage, and enter the desired value.
This value denes the point at which vRealize Operations Manager considers the percentage of demand to
be stress. For example, to change the stress threshold for Memory Demand, double-click the current
percentage, such as 70.0 % of capacity, and enter the new percentage of demand to exceed for
vRealize Operations Manager to identify stress.
For each resource, you can change the sliding analysis window value to include the entire range, and set the
peak value to a dierent time depending on how you need vRealize Operations Manager to derive the stress
score.
More About the Stress Score
vRealize Operations Manager calculates the stress zone and stress score for you. The following explanations
cover typical scenarios where Demand does not exceed Capacity.
To determine the stress on an object for a specic time period, you can examine the demand curve to
determine how much of the stress zone the demand occupies. The stress zone is typically where demand
exceeds 70 percent of the total capacity. For example, stress occurs when CPU demand, memory demand, or
memory consumed exceeds 70 percent of the capacity.
In a 60-minute peak period, vRealize Operations Manager bases the Stress score calculation on the following
variables:
n
Stress threshold, which is the Demand Exceeds seing
n
Stress score threshold, which determines the color of the Stress badge
n
Time range, as in 30 days of analysis
n
Peak detection window, which is the 60-minute peak seing that you can adjust to either a non-zero
number of minutes or the entire range.
When the demand exceeds 70 percent, that data point in time is in the Stress zone.
In the policy stress analysis seings, to examine an example graph used to calculate stress, click What is
stress?.
Another example to explain the calculation used for CPU stress is shown here.
vRealize Operations Manager User Guide
82 VMware, Inc.