
6.4
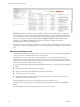
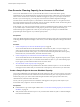
Table Of Contents
- vRealize Operations Manager User Guide
- Contents
- About This User Guide
- Monitoring Objects in Your Managed Environment
- What to Do When...
- User Scenario: A User Calls With a Problem
- User Scenario: An Alert Arrives in Your Inbox
- Respond to an Alert in Your Email
- Evaluate Other Triggered Symptoms for the Affected Data Store
- Compare Alerts and Events Over Time in Response to a Datastore Alert
- View the Affected Datastore in Relation to Other Objects
- Construct Metric Charts to Investigate the Cause of the Data Store Alert
- Run a Recommendation On a Datastore to Resolve an Alert
- User Scenario: You See Problems as You Monitor the State of Your Objects
- Monitoring and Responding to Alerts
- Monitoring and Responding to Problems
- Evaluating Object Summary Information
- Investigating Object Alerts
- Evaluating Metric Information
- Analyzing the Resources in Your Environment
- Using Troubleshooting Tools to Resolve Problems
- Creating and Using Object Details
- Examining Relationships in Your Environment
- User Scenario: Investigate the Root Cause a Problem Using Troubleshooting Tab Options
- Running Actions from vRealize Operations Manager
- List of vRealize Operations Manager Actions
- Working With Actions That Use Power Off Allowed
- Actions Supported for Automation
- Integration of Actions with vRealize Automation
- Run Actions From Toolbars in vRealize Operations Manager
- Troubleshoot Actions in vRealize Operations Manager
- Monitor Recent Task Status
- Troubleshoot Failed Tasks
- Determine If a Recent Task Failed
- Troubleshooting Maximum Time Reached Task Status
- Troubleshooting Set CPU or Set Memory Failed Tasks
- Troubleshooting Set CPU Count or Set Memory with Powered Off Allowed
- Troubleshooting Set CPU Count and Memory When Values Not Supported
- Troubleshooting Set CPU Resources or Set Memory Resources When the Value is Not Supported
- Troubleshooting Set CPU Resources or Set Memory Resources When the Value is Too High
- Troubleshooting Set Memory Resources When the Value is Not Evenly Divisible by 1024
- Troubleshooting Failed Shut Down VM Action Status
- Troubleshooting VMware Tools Not Running for a Shut Down VM Action Status
- Troubleshooting Failed Delete Unused Snapshots Action Status
- Viewing Your Inventory
- What to Do When...
- Planning the Capacity for Your Managed Environment
- Index
Where to Find Stress-Free Demand and Stress-Free Value
In some areas of the user interface, vRealize Operations Manager identies capacity as Stress Free Demand,
and in other areas it is identied as Stress Free Value. Both terms mean that the calculated capacity for an
object is free from unacceptable levels of contention and stress, as dened in the policy for the Stress score.
Stress Free Demand appears in Troubleshooting > All Metrics, Views, and Reports.
n
In Troubleshooting > All Metrics, you can use the metric named Stress Free Demand to examine the
CPU demand, disk space allocation and demand, memory consumed, and the vSphere conguration
limit on an object. When you apply this metric to these resources, you can build a metric graph to
display the stress-free demand for an object. The graph displays the high and low stress-free capacity
values over time.
n
In Content > Views, when you add or edit a view, in the Data and Conguration areas of the
workspace, you can use the metric named Stress Free Demand. Use this metric to build views for CPU
demand, disk space allocation and demand, memory consumed, and the vSphere conguration limit.
n
In Content > Reports, you can use a view that includes the metric named Stress Free Demand to
generate a report. The table in the report displays Stress Free Demand as the label. For example, this
metric appears in the report named Cluster CPU Demand (%) Trend View.
Stress Free Value appears on the Object > Analysis > Time Remaining tab, and on the Object > Analysis >
Stress tab.
n
On the Object > Analysis > Time Remaining tab, you can view the time remaining for CPU demand,
memory consumed, disk space demand and allocation, and the vSphere conguration limit. In this
view, the table column name is Stress Free Value.
n
On the Object > Analysis > Stress tab, the table column name is Stress Free Value. The tables display
Stress Free Value as the calculated values for CPU demand, memory consumed, and the vSphere
conguration limit.
Setting the Thresholds for the Stress Score
The analysis seings in the policy that you apply to your objects denes the thresholds for the stress score.
The policy includes default seings for the stress score to be green, yellow, orange, or red. If the seings are
too strict or loose for your environment, you can modify them.
To modify the stress score thresholds, edit the policy that applies to your objects, and click Analysis
. Select an object type and click the lter icon to display the policy analysis seings. In the Stress
area, click the lock icon, expand Stress, and modify the stress thresholds.
In the analysis stress seings, vRealize Operations Manager uses the selected resources, such as Memory
Demand, CPU Demand, and vSphere Conguration Limit to calculate the stress score.
You can set the stress thresholds to your own values, or turn them o. To change a stress score threshold,
click and drag an icon along the slider. To remove a scoring range, such as the default range of 35–49
identied by orange, double-click an icon to disable the range.
Chapter 2 Planning the Capacity for Your Managed Environment Using vRealize Operations Manager
VMware, Inc. 81