
6.4
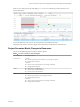
Table Of Contents
- vRealize Operations Manager User Guide
- Contents
- About This User Guide
- Monitoring Objects in Your Managed Environment
- What to Do When...
- User Scenario: A User Calls With a Problem
- User Scenario: An Alert Arrives in Your Inbox
- Respond to an Alert in Your Email
- Evaluate Other Triggered Symptoms for the Affected Data Store
- Compare Alerts and Events Over Time in Response to a Datastore Alert
- View the Affected Datastore in Relation to Other Objects
- Construct Metric Charts to Investigate the Cause of the Data Store Alert
- Run a Recommendation On a Datastore to Resolve an Alert
- User Scenario: You See Problems as You Monitor the State of Your Objects
- Monitoring and Responding to Alerts
- Monitoring and Responding to Problems
- Evaluating Object Summary Information
- Investigating Object Alerts
- Evaluating Metric Information
- Analyzing the Resources in Your Environment
- Using Troubleshooting Tools to Resolve Problems
- Creating and Using Object Details
- Examining Relationships in Your Environment
- User Scenario: Investigate the Root Cause a Problem Using Troubleshooting Tab Options
- Running Actions from vRealize Operations Manager
- List of vRealize Operations Manager Actions
- Working With Actions That Use Power Off Allowed
- Actions Supported for Automation
- Integration of Actions with vRealize Automation
- Run Actions From Toolbars in vRealize Operations Manager
- Troubleshoot Actions in vRealize Operations Manager
- Monitor Recent Task Status
- Troubleshoot Failed Tasks
- Determine If a Recent Task Failed
- Troubleshooting Maximum Time Reached Task Status
- Troubleshooting Set CPU or Set Memory Failed Tasks
- Troubleshooting Set CPU Count or Set Memory with Powered Off Allowed
- Troubleshooting Set CPU Count and Memory When Values Not Supported
- Troubleshooting Set CPU Resources or Set Memory Resources When the Value is Not Supported
- Troubleshooting Set CPU Resources or Set Memory Resources When the Value is Too High
- Troubleshooting Set Memory Resources When the Value is Not Evenly Divisible by 1024
- Troubleshooting Failed Shut Down VM Action Status
- Troubleshooting VMware Tools Not Running for a Shut Down VM Action Status
- Troubleshooting Failed Delete Unused Snapshots Action Status
- Viewing Your Inventory
- What to Do When...
- Planning the Capacity for Your Managed Environment
- Index

When you view both projects, the chart displays 1.1, 1.2, and 2.1 to indicate the point in time when each
scenario takes eect.
To view the details about the scenario, move the pointer to the number in the chart.
The projects and scenarios continue to appear in the chart until you delete them or refresh the view.
Project Scenarios Model Changes to Resources
You can use the following project scenarios to forecast capacity.
Table 2‑1. Project Scenarios for Selected Objects
Selected Object Project Scenarios
vCenter Server Capacity
n
Add or remove host system, datastore, or percentage of capacity.
n
Change absolute capacity.
Demand
n
Add or remove virtual machine or percentage of demand.
n
Change absolute demand.
Cluster
n
Add, remove, or update hosts.
n
Add, remove, or update datastores.
n
Add or remove virtual machines.
Host Capacity
n
Add or remove datastore, or percentage of capacity.
n
Change absolute capacity.
Demand
n
Add or remove virtual machine or percentage of demand.
n
Change absolute demand.
Chapter 2 Planning the Capacity for Your Managed Environment Using vRealize Operations Manager
VMware, Inc. 79