
6.4
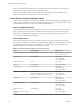
Table Of Contents
- vRealize Operations Manager User Guide
- Contents
- About This User Guide
- Monitoring Objects in Your Managed Environment
- What to Do When...
- User Scenario: A User Calls With a Problem
- User Scenario: An Alert Arrives in Your Inbox
- Respond to an Alert in Your Email
- Evaluate Other Triggered Symptoms for the Affected Data Store
- Compare Alerts and Events Over Time in Response to a Datastore Alert
- View the Affected Datastore in Relation to Other Objects
- Construct Metric Charts to Investigate the Cause of the Data Store Alert
- Run a Recommendation On a Datastore to Resolve an Alert
- User Scenario: You See Problems as You Monitor the State of Your Objects
- Monitoring and Responding to Alerts
- Monitoring and Responding to Problems
- Evaluating Object Summary Information
- Investigating Object Alerts
- Evaluating Metric Information
- Analyzing the Resources in Your Environment
- Using Troubleshooting Tools to Resolve Problems
- Creating and Using Object Details
- Examining Relationships in Your Environment
- User Scenario: Investigate the Root Cause a Problem Using Troubleshooting Tab Options
- Running Actions from vRealize Operations Manager
- List of vRealize Operations Manager Actions
- Working With Actions That Use Power Off Allowed
- Actions Supported for Automation
- Integration of Actions with vRealize Automation
- Run Actions From Toolbars in vRealize Operations Manager
- Troubleshoot Actions in vRealize Operations Manager
- Monitor Recent Task Status
- Troubleshoot Failed Tasks
- Determine If a Recent Task Failed
- Troubleshooting Maximum Time Reached Task Status
- Troubleshooting Set CPU or Set Memory Failed Tasks
- Troubleshooting Set CPU Count or Set Memory with Powered Off Allowed
- Troubleshooting Set CPU Count and Memory When Values Not Supported
- Troubleshooting Set CPU Resources or Set Memory Resources When the Value is Not Supported
- Troubleshooting Set CPU Resources or Set Memory Resources When the Value is Too High
- Troubleshooting Set Memory Resources When the Value is Not Evenly Divisible by 1024
- Troubleshooting Failed Shut Down VM Action Status
- Troubleshooting VMware Tools Not Running for a Shut Down VM Action Status
- Troubleshooting Failed Delete Unused Snapshots Action Status
- Viewing Your Inventory
- What to Do When...
- Planning the Capacity for Your Managed Environment
- Index

Working with Heat Maps
With the vRealize Operations Manager heat map feature, you can locate trouble areas based on the metric
values for objects in your virtual infrastructure. vRealize Operations Manager uses analytics algorithms that
you can use to compare the performance of objects across the virtual infrastructure in real time using heat
maps.
You can use predened heat maps or create your own custom heat maps to compare the metric values of
objects in your virtual environment. vRealize Operations Manager has predened heat maps on the Details
tab that you can use to compare commonly used metrics. You can use this data to plan to reduce waste and
increase capacity in the virtual infrastructure.
What a Heat Map Shows
A heat map contains rectangles of dierent sizes and colors, and each rectangle represents an object in your
virtual environment. The color of the rectangle represents the value of one metric, and the size of the
rectangle represents the value of another metric. For example, one heat map shows the total memory and
percentage of memory use for each virtual machine. Larger rectangles are virtual machines with more total
memory, green indicates low memory use, and red indicates high use.
vRealize Operations Manager updates the heat maps in real time as new values are collected for each object
and metric. The colored bar below the heat map is the legend. The legend identies the values that the
endpoints represent and the midpoint of the color range.
Heat map objects are grouped by parent. For example, a heat map that shows virtual machine performance,
groups the virtual machines by the ESX hosts on which they run.
Create a Custom Heat Map
You can dene an unlimited number of custom heat maps to analyze exactly the metrics that you need.
Procedure
1 In the left pane of vRealize Operations Manager, click Environment.
2 Select an object to inspect from an inventory tree.
3 Click the Heat Map tab under the Details tab.
4 Select the tag to use for rst-level grouping of the objects from the Group By drop-down menu.
If a selected object does not have a value for this tag, it appears in a group called Other Groups.
5 Select the tag to use to separate the objects into subgroups from the Then By drop-down menu.
If a selected object does not have a value for this tag, it appears in a subgroup called Other Groups.
6 Select a Mode option.
Option Description
Instance
Track all instances of a metric for an object with a separate rectangle for
each metric.
General
Pick an specic instance of a metric for each object and track only that
metric.
7 If you selected General mode, select the aribute to use to set the size of the rectangle for each resource
in the Size By list and the aribute to use to determine the color of the rectangle for each object in the
Color By list.
Objects that have higher values for the Size By aribute have larger areas in the heat map display. You
can also select xed-size rectangles. The color varies between the colors you set based on the value of
the Color By aribute.
Chapter 1 Monitoring Objects in Your Managed Environment by Using vRealize Operations Manager
VMware, Inc. 51