
6.4
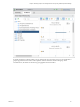
Table Of Contents
- vRealize Operations Manager User Guide
- Contents
- About This User Guide
- Monitoring Objects in Your Managed Environment
- What to Do When...
- User Scenario: A User Calls With a Problem
- User Scenario: An Alert Arrives in Your Inbox
- Respond to an Alert in Your Email
- Evaluate Other Triggered Symptoms for the Affected Data Store
- Compare Alerts and Events Over Time in Response to a Datastore Alert
- View the Affected Datastore in Relation to Other Objects
- Construct Metric Charts to Investigate the Cause of the Data Store Alert
- Run a Recommendation On a Datastore to Resolve an Alert
- User Scenario: You See Problems as You Monitor the State of Your Objects
- Monitoring and Responding to Alerts
- Monitoring and Responding to Problems
- Evaluating Object Summary Information
- Investigating Object Alerts
- Evaluating Metric Information
- Analyzing the Resources in Your Environment
- Using Troubleshooting Tools to Resolve Problems
- Creating and Using Object Details
- Examining Relationships in Your Environment
- User Scenario: Investigate the Root Cause a Problem Using Troubleshooting Tab Options
- Running Actions from vRealize Operations Manager
- List of vRealize Operations Manager Actions
- Working With Actions That Use Power Off Allowed
- Actions Supported for Automation
- Integration of Actions with vRealize Automation
- Run Actions From Toolbars in vRealize Operations Manager
- Troubleshoot Actions in vRealize Operations Manager
- Monitor Recent Task Status
- Troubleshoot Failed Tasks
- Determine If a Recent Task Failed
- Troubleshooting Maximum Time Reached Task Status
- Troubleshooting Set CPU or Set Memory Failed Tasks
- Troubleshooting Set CPU Count or Set Memory with Powered Off Allowed
- Troubleshooting Set CPU Count and Memory When Values Not Supported
- Troubleshooting Set CPU Resources or Set Memory Resources When the Value is Not Supported
- Troubleshooting Set CPU Resources or Set Memory Resources When the Value is Too High
- Troubleshooting Set Memory Resources When the Value is Not Evenly Divisible by 1024
- Troubleshooting Failed Shut Down VM Action Status
- Troubleshooting VMware Tools Not Running for a Shut Down VM Action Status
- Troubleshooting Failed Delete Unused Snapshots Action Status
- Viewing Your Inventory
- What to Do When...
- Planning the Capacity for Your Managed Environment
- Index
Timeline Tab Overview
The timeline provides a view of the triggered symptoms, generated alerts, and events for an object over a
period of time. You use the timeline to identify common trends over time that are contributing to the current
status of objects in your environment.
The timeline provides a three-tier scrolling mechanism that you can use to move quickly through large
spans of time, or slowly and minutely through individual hours when you are focusing on a particular
period of time. To ensure that you have the data that you need, congure the Date Controls to encompass
the problem you are investigating.
It is not always eective to investigate a problem on an individual object by looking only at the object. Use
the ancestor, descendant, and peer options to examine the object in a broader environmental context. This
context often reveals unexpected inuences or consequences for the problem.
The timeline is a tool that provides you a graphical view of paerns. If a symptom is triggered and canceled
by the system at various intervals over time, you can compare the event to other changes to the object or to
the related objects. These changes might be the root cause of the problem.
Events Tab Overview
Events are changes in vRealize Operations Manager metrics that reect changes that occurred on managed
objects because of user actions, system actions, triggered symptoms, or generated alerts on an object. You
use the Events tab to compare the occurrence of events with the generated alerts to determine if a change on
your managed object contributed to the root cause of the alert or other problems with the object.
Events can occur on any object, not just the one listed.
The following vCenter Server activities are some of the activities that generate vRealize Operations Manager
events:
n
Powering a virtual machine on or o
n
Creating a virtual machine
n
Installing VMware Tools on the guest OS of a virtual machine
n
Adding a newly congured ESX/ESXi system to a vCenter Server system
Depending on alert denitions, these events might generate alerts.
If you monitor the same virtual machines with other applications that provide information to
vRealize Operations Manager, and the adapters for those applications are congured to provide change
events, the Events tab includes certain change events that occur on the monitored objects. These change
events might provide further insight into the cause of problems that you are investigating.
Creating and Using Object Details
The views and heat map details provide you with specic data about the object. You use this information to
evaluate problems in more detail. If the current views or heat maps do not provide the information that you
need, you can create one to use as tool as you investigate your specic problem.
vRealize Operations Manager User Guide
50 VMware, Inc.