
6.4
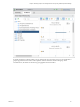
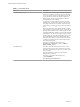
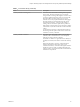
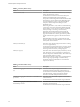
Table Of Contents
- vRealize Operations Manager User Guide
- Contents
- About This User Guide
- Monitoring Objects in Your Managed Environment
- What to Do When...
- User Scenario: A User Calls With a Problem
- User Scenario: An Alert Arrives in Your Inbox
- Respond to an Alert in Your Email
- Evaluate Other Triggered Symptoms for the Affected Data Store
- Compare Alerts and Events Over Time in Response to a Datastore Alert
- View the Affected Datastore in Relation to Other Objects
- Construct Metric Charts to Investigate the Cause of the Data Store Alert
- Run a Recommendation On a Datastore to Resolve an Alert
- User Scenario: You See Problems as You Monitor the State of Your Objects
- Monitoring and Responding to Alerts
- Monitoring and Responding to Problems
- Evaluating Object Summary Information
- Investigating Object Alerts
- Evaluating Metric Information
- Analyzing the Resources in Your Environment
- Using Troubleshooting Tools to Resolve Problems
- Creating and Using Object Details
- Examining Relationships in Your Environment
- User Scenario: Investigate the Root Cause a Problem Using Troubleshooting Tab Options
- Running Actions from vRealize Operations Manager
- List of vRealize Operations Manager Actions
- Working With Actions That Use Power Off Allowed
- Actions Supported for Automation
- Integration of Actions with vRealize Automation
- Run Actions From Toolbars in vRealize Operations Manager
- Troubleshoot Actions in vRealize Operations Manager
- Monitor Recent Task Status
- Troubleshoot Failed Tasks
- Determine If a Recent Task Failed
- Troubleshooting Maximum Time Reached Task Status
- Troubleshooting Set CPU or Set Memory Failed Tasks
- Troubleshooting Set CPU Count or Set Memory with Powered Off Allowed
- Troubleshooting Set CPU Count and Memory When Values Not Supported
- Troubleshooting Set CPU Resources or Set Memory Resources When the Value is Not Supported
- Troubleshooting Set CPU Resources or Set Memory Resources When the Value is Too High
- Troubleshooting Set Memory Resources When the Value is Not Evenly Divisible by 1024
- Troubleshooting Failed Shut Down VM Action Status
- Troubleshooting VMware Tools Not Running for a Shut Down VM Action Status
- Troubleshooting Failed Delete Unused Snapshots Action Status
- Viewing Your Inventory
- What to Do When...
- Planning the Capacity for Your Managed Environment
- Index

Table 1‑4. Storage Metric Group
Metric Description
Datastore I/O|Average observed virtual machine disk I/O
workload
Storage adapter|Aggregate of all instances|Read latency
(ms)
This metric shows the average amount of time required for
a read operation by all the storage adapters.
Use this metric to monitor the read operation of the storage
adapter. A high value indicates that the ESXi is
experiencing storage read operation slowness.
The total latency is the sum of kernel latency and device
latency.
Storage adapter|Aggregate of all instances|Write latency
(ms)
This metric shows the average amount of time required for
a write operation by all the storage adapters.
Use this metric to monitor the write operation performance
of the storage adapter. A high value indicates that the ESXi
is experiencing storage write operation slowness.
The total latency is the sum of the kernel latency and
device latency.
Analyzing the Resources in Your Environment
In addition to monitoring, vRealize Operations Manager provides you with powerful tools for analyzing the
resources and the performance of your virtual environment.
You can use the Analysis tab to analyze the current condition of your virtual environment.
Using Troubleshooting Tools to Resolve Problems
The data provided in the Symptoms, Timeline, Events, and All Metrics tabs help you identify the root
cause of a problem that is not resolved by alert recommendations or simple analysis.
As you are troubleshooting problems with objects in your environment, you can use the troubleshooting
tabs individually or as part of a workow. Each of the tabs displays the collected data in a dierent way.
Sometimes, as you are troubleshooting problems, you move directly from an analysis tab to the All
MetricsAll Metrics tab. Under other circumstances, you know that the Timeline tab might provide the
information that you need.
Symptoms Tab Overview
You can view a list of triggered symptoms for the selected object. You use the symptoms when you are
troubleshooting problems with an object.
The Symptoms tab displays all the triggered symptoms for the currently selected object. A review of the
triggered symptoms provides you with a list of the problems that the currently selected object is
experiencing. If you need to beer understand which symptoms are associated with currently generated
alerts, go to the Alerts tab for the object.
As you evaluate the triggered symptoms, consider the time at which they were created and the
conguration information and trend charts, where applicable.
Chapter 1 Monitoring Objects in Your Managed Environment by Using vRealize Operations Manager
VMware, Inc. 49