
6.4
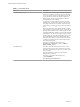
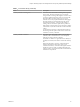
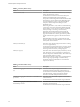
Table Of Contents
- vRealize Operations Manager User Guide
- Contents
- About This User Guide
- Monitoring Objects in Your Managed Environment
- What to Do When...
- User Scenario: A User Calls With a Problem
- User Scenario: An Alert Arrives in Your Inbox
- Respond to an Alert in Your Email
- Evaluate Other Triggered Symptoms for the Affected Data Store
- Compare Alerts and Events Over Time in Response to a Datastore Alert
- View the Affected Datastore in Relation to Other Objects
- Construct Metric Charts to Investigate the Cause of the Data Store Alert
- Run a Recommendation On a Datastore to Resolve an Alert
- User Scenario: You See Problems as You Monitor the State of Your Objects
- Monitoring and Responding to Alerts
- Monitoring and Responding to Problems
- Evaluating Object Summary Information
- Investigating Object Alerts
- Evaluating Metric Information
- Analyzing the Resources in Your Environment
- Using Troubleshooting Tools to Resolve Problems
- Creating and Using Object Details
- Examining Relationships in Your Environment
- User Scenario: Investigate the Root Cause a Problem Using Troubleshooting Tab Options
- Running Actions from vRealize Operations Manager
- List of vRealize Operations Manager Actions
- Working With Actions That Use Power Off Allowed
- Actions Supported for Automation
- Integration of Actions with vRealize Automation
- Run Actions From Toolbars in vRealize Operations Manager
- Troubleshoot Actions in vRealize Operations Manager
- Monitor Recent Task Status
- Troubleshoot Failed Tasks
- Determine If a Recent Task Failed
- Troubleshooting Maximum Time Reached Task Status
- Troubleshooting Set CPU or Set Memory Failed Tasks
- Troubleshooting Set CPU Count or Set Memory with Powered Off Allowed
- Troubleshooting Set CPU Count and Memory When Values Not Supported
- Troubleshooting Set CPU Resources or Set Memory Resources When the Value is Not Supported
- Troubleshooting Set CPU Resources or Set Memory Resources When the Value is Too High
- Troubleshooting Set Memory Resources When the Value is Not Evenly Divisible by 1024
- Troubleshooting Failed Shut Down VM Action Status
- Troubleshooting VMware Tools Not Running for a Shut Down VM Action Status
- Troubleshooting Failed Delete Unused Snapshots Action Status
- Viewing Your Inventory
- What to Do When...
- Planning the Capacity for Your Managed Environment
- Index

Table 1‑2. Memory Metric Group
Metric Description
Memory|Balloon (KB) This metric shows the total amount of memory currently
used by the VM memory control.
Use this metric to monitor how much VM memory the
ESXi has reclaimed through memory ballooning.
The presence of ballooning indicates that the ESXi has been
under memory pressure. ESXi activates ballooning when
its consumed memory reaches a specic threshold. For
example, in vRealize Operations Manager 6.0, the
threshold is >98%.
When using this metric, verify if the size of the ballooning
is increasing. An increase in ballooning indicates that the
lack of memory is not a one time occurrence, and that the
memory shortage is worsening. Look for memory
uctuations which indicate that the VM required the
ballooned out page. If the VM requests a ballooned out
page, this translates into a memory performance problem
for the VM because the page has to be returned from the
disk.
When the balloon target value is greater than the value
shown by the metric, it means that there is more available
memory that can be reclaimed.
Memory|Contention (%) This metric shows the percentage of time VMs are waiting
to access swapped memory.
Use this metric to monitor ESXi memory swapping. A high
value indicates that the ESXi is running low on memory,
and a large amount of memory is being swapped.
Memory|Usage (%) This metric shows the amount of physical memory actively
used. The memory usage is displayed as a percentage of
the total congured or available memory. This metric maps
to the Consumed counter in vCenter.
When the metric displays a high value, it indicates that the
ESXi is using a large percentage of available memory.
Check other memory-related metrics to see if the ESXi
requires more memory.
Table 1‑3. Network Metric Group
Metric Description
Network I/O | Aggregate of all instances | Packet Dropped
(%)
This metric shows the percentage of received and
transmied packets dropped in the collection interval.
Use this metric to monitor the reliability and performance
of the ESXi network. A high value indicates that the
network is not reliable and performance decreases.
Network I/O | Aggregate of all instances | Packet Received
per second
This metric shows the number of packets received in the
collection interval.
Use this metric to monitor the network usage of the ESXi.
Network I/O | Aggregate of all instances | Packet
Transmied per second
This metric shows the number of packets transmied
during the collection interval.
Use this metric to monitor the network usage of the ESXi.
vRealize Operations Manager User Guide
48 VMware, Inc.