
6.4
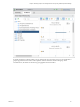
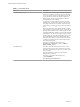
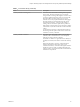
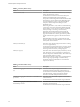
Table Of Contents
- vRealize Operations Manager User Guide
- Contents
- About This User Guide
- Monitoring Objects in Your Managed Environment
- What to Do When...
- User Scenario: A User Calls With a Problem
- User Scenario: An Alert Arrives in Your Inbox
- Respond to an Alert in Your Email
- Evaluate Other Triggered Symptoms for the Affected Data Store
- Compare Alerts and Events Over Time in Response to a Datastore Alert
- View the Affected Datastore in Relation to Other Objects
- Construct Metric Charts to Investigate the Cause of the Data Store Alert
- Run a Recommendation On a Datastore to Resolve an Alert
- User Scenario: You See Problems as You Monitor the State of Your Objects
- Monitoring and Responding to Alerts
- Monitoring and Responding to Problems
- Evaluating Object Summary Information
- Investigating Object Alerts
- Evaluating Metric Information
- Analyzing the Resources in Your Environment
- Using Troubleshooting Tools to Resolve Problems
- Creating and Using Object Details
- Examining Relationships in Your Environment
- User Scenario: Investigate the Root Cause a Problem Using Troubleshooting Tab Options
- Running Actions from vRealize Operations Manager
- List of vRealize Operations Manager Actions
- Working With Actions That Use Power Off Allowed
- Actions Supported for Automation
- Integration of Actions with vRealize Automation
- Run Actions From Toolbars in vRealize Operations Manager
- Troubleshoot Actions in vRealize Operations Manager
- Monitor Recent Task Status
- Troubleshoot Failed Tasks
- Determine If a Recent Task Failed
- Troubleshooting Maximum Time Reached Task Status
- Troubleshooting Set CPU or Set Memory Failed Tasks
- Troubleshooting Set CPU Count or Set Memory with Powered Off Allowed
- Troubleshooting Set CPU Count and Memory When Values Not Supported
- Troubleshooting Set CPU Resources or Set Memory Resources When the Value is Not Supported
- Troubleshooting Set CPU Resources or Set Memory Resources When the Value is Too High
- Troubleshooting Set Memory Resources When the Value is Not Evenly Divisible by 1024
- Troubleshooting Failed Shut Down VM Action Status
- Troubleshooting VMware Tools Not Running for a Shut Down VM Action Status
- Troubleshooting Failed Delete Unused Snapshots Action Status
- Viewing Your Inventory
- What to Do When...
- Planning the Capacity for Your Managed Environment
- Index

Table 1‑1. CPU Metric Group
Metric Description
CPU|CPU contention (%) This metric shows the percentage of time the VMs in the
ESXi hosts are unable to run because they are contending
for access to the physical CPUs. The number shown is the
average number for all VMs. The number will be lower
than the highest number experienced by the VM that is
most impacted by CPU contention.
Use this metric to verify if the host can serve all its VMs
eciently. Low contention means that the VM can access
everything it demands to run smoothly. It means that the
infrastructure is providing good service to the application
team.
When using this metric, ensure that the number is within
your expectation. Look at both the relative number and the
absolute number. Relative means a drastic change in value,
meaning that the ESXi is unable to serve the VMs. Absolute
means that the real value itself is high. Investigate why the
number is high. One factor that impacts this metric is CPU
Power Management. If CPU Power Management clocks
down the CPU speed from 3 GHz to 2 GHz, the reduction
in speed is accounted for because it shows that the VM is
not running at full speed.
This metric is calculated in the following way:
cpu|capacity_contention / (200 * summary|
number_running_vcpus)
CPU|Demand (%) This metric shows the amount of CPU resources a VM
would use if there were no CPU contention or CPU limit.
This metric represents the average active CPU load for the
past ve minutes.
Keep this number below 100% if you set the power
management to maximum.
This metric is calculated in the following way:
( cpu.demandmhz /
cpu.capacity_provisioned)*100 .
vRealize Operations Manager User Guide
46 VMware, Inc.