
6.4
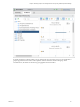
Table Of Contents
- vRealize Operations Manager User Guide
- Contents
- About This User Guide
- Monitoring Objects in Your Managed Environment
- What to Do When...
- User Scenario: A User Calls With a Problem
- User Scenario: An Alert Arrives in Your Inbox
- Respond to an Alert in Your Email
- Evaluate Other Triggered Symptoms for the Affected Data Store
- Compare Alerts and Events Over Time in Response to a Datastore Alert
- View the Affected Datastore in Relation to Other Objects
- Construct Metric Charts to Investigate the Cause of the Data Store Alert
- Run a Recommendation On a Datastore to Resolve an Alert
- User Scenario: You See Problems as You Monitor the State of Your Objects
- Monitoring and Responding to Alerts
- Monitoring and Responding to Problems
- Evaluating Object Summary Information
- Investigating Object Alerts
- Evaluating Metric Information
- Analyzing the Resources in Your Environment
- Using Troubleshooting Tools to Resolve Problems
- Creating and Using Object Details
- Examining Relationships in Your Environment
- User Scenario: Investigate the Root Cause a Problem Using Troubleshooting Tab Options
- Running Actions from vRealize Operations Manager
- List of vRealize Operations Manager Actions
- Working With Actions That Use Power Off Allowed
- Actions Supported for Automation
- Integration of Actions with vRealize Automation
- Run Actions From Toolbars in vRealize Operations Manager
- Troubleshoot Actions in vRealize Operations Manager
- Monitor Recent Task Status
- Troubleshoot Failed Tasks
- Determine If a Recent Task Failed
- Troubleshooting Maximum Time Reached Task Status
- Troubleshooting Set CPU or Set Memory Failed Tasks
- Troubleshooting Set CPU Count or Set Memory with Powered Off Allowed
- Troubleshooting Set CPU Count and Memory When Values Not Supported
- Troubleshooting Set CPU Resources or Set Memory Resources When the Value is Not Supported
- Troubleshooting Set CPU Resources or Set Memory Resources When the Value is Too High
- Troubleshooting Set Memory Resources When the Value is Not Evenly Divisible by 1024
- Troubleshooting Failed Shut Down VM Action Status
- Troubleshooting VMware Tools Not Running for a Shut Down VM Action Status
- Troubleshooting Failed Delete Unused Snapshots Action Status
- Viewing Your Inventory
- What to Do When...
- Planning the Capacity for Your Managed Environment
- Index
c Click the alert name in the widget.
For example, click the Acct VM CPU early warning Risk alert. The Alert Details Summary tab
appears.
d Resolve the alert based on recommendations.
For example, to use the If this is a standalone host, add more memory to the host
recommendation, click the link to the instructions for adding memory to a host.
6 To return to the Accounting VMs and Hosts dashboard so that you can process more alerts, click the
back buon located on the left pane toolbar.
7 Select the next alert in the alert list and continue processing the alerts.
What to do next
After a few collection cycles, look again at your alerts to determine if they were canceled and no longer
appear in the dashboard. If the alerts are still present, see “User Scenario: Investigate the Root Cause of a
Problem by Using the Troubleshooting Tab Options,” on page 56 for an example troubleshooting workow.
Evaluating Metric Information
The All Metrics tab provides a relationship map and user-dened metric charts. The topological map helps
you evaluate objects in the context of their place in your environment topology. The metric charts are based
on the metrics for the selected object that you think will help you identify the possible cause of a problem in
your environment.
Although you might be investigating problems with a single object, for example, a host system, the
relationship map allows you to see the host in the context of parent and child objects. It is also works as a
hierarchical navigation system. If you double-click an object in the map, that object becomes the focus of the
map and the available metrics for the object are active in the lower-left pane.
You can also build your own set of metric charts. You select the objects and metrics so that you can get a
more detailed view of changes to dierent metrics for a single object, or for related objects over time.
Where available, the tab also provides pre-dened sets of metric to help you when looking at a specic
aspect of an object. The metrics are organized into the most relevant groups for the selected object, and
provide the most relevant metrics. For example, for a host, the metrics are displayed under CPU, Memory,
Network, and Storage.
Create Metric Charts When You Troubleshoot a Virtual Machine Problem
You create a custom group of metric charts when you troubleshoot a problem with a virtual machine so that
you can compare dierent metrics. The level of detail that you can create using the All Metrics tab in
vRealize Operations Manager can contribute signicantly to your eort to nd the root cause of a problem.
As a virtual infrastructure administrator investigating a reported performance problem with a virtual
machine, you determined that you need to see detailed charts about the following reported symptoms.
n
Guest le system overall disk space usage reaching critical limit
n
Guest partition disk space usage
The following method of evaluating problems using the All Metrics tab is provided as an example for using
vRealize Operations Manager and is not denitive. Your troubleshooting skills and your knowledge of the
particulars of your environment determine which methods work for you.
Procedure
1 Enter the name of the virtual machine in the Search text box, located on the main title bar.
In this example, the virtual machine name is sales-10-dk.
Chapter 1 Monitoring Objects in Your Managed Environment by Using vRealize Operations Manager
VMware, Inc. 43