
6.4
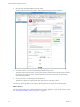
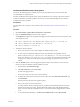
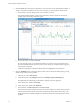
Table Of Contents
- vRealize Operations Manager User Guide
- Contents
- About This User Guide
- Monitoring Objects in Your Managed Environment
- What to Do When...
- User Scenario: A User Calls With a Problem
- User Scenario: An Alert Arrives in Your Inbox
- Respond to an Alert in Your Email
- Evaluate Other Triggered Symptoms for the Affected Data Store
- Compare Alerts and Events Over Time in Response to a Datastore Alert
- View the Affected Datastore in Relation to Other Objects
- Construct Metric Charts to Investigate the Cause of the Data Store Alert
- Run a Recommendation On a Datastore to Resolve an Alert
- User Scenario: You See Problems as You Monitor the State of Your Objects
- Monitoring and Responding to Alerts
- Monitoring and Responding to Problems
- Evaluating Object Summary Information
- Investigating Object Alerts
- Evaluating Metric Information
- Analyzing the Resources in Your Environment
- Using Troubleshooting Tools to Resolve Problems
- Creating and Using Object Details
- Examining Relationships in Your Environment
- User Scenario: Investigate the Root Cause a Problem Using Troubleshooting Tab Options
- Running Actions from vRealize Operations Manager
- List of vRealize Operations Manager Actions
- Working With Actions That Use Power Off Allowed
- Actions Supported for Automation
- Integration of Actions with vRealize Automation
- Run Actions From Toolbars in vRealize Operations Manager
- Troubleshoot Actions in vRealize Operations Manager
- Monitor Recent Task Status
- Troubleshoot Failed Tasks
- Determine If a Recent Task Failed
- Troubleshooting Maximum Time Reached Task Status
- Troubleshooting Set CPU or Set Memory Failed Tasks
- Troubleshooting Set CPU Count or Set Memory with Powered Off Allowed
- Troubleshooting Set CPU Count and Memory When Values Not Supported
- Troubleshooting Set CPU Resources or Set Memory Resources When the Value is Not Supported
- Troubleshooting Set CPU Resources or Set Memory Resources When the Value is Too High
- Troubleshooting Set Memory Resources When the Value is Not Evenly Divisible by 1024
- Troubleshooting Failed Shut Down VM Action Status
- Troubleshooting VMware Tools Not Running for a Shut Down VM Action Status
- Troubleshooting Failed Delete Unused Snapshots Action Status
- Viewing Your Inventory
- What to Do When...
- Planning the Capacity for Your Managed Environment
- Index
d Click the Details tab, and click Views, and click the Virtual Machine Reclaimable Capacity view.
e In the lower pane, click the title of the Reclaimable Memory column to sort the list of virtual
machines so that the largest amount of reclaimable capacity is on top.
f To reclaim capacity from several virtual machines, click to the right of the rst virtual machine
name, then press Shift and click to the right of the last virtual machine that has capacity to reclaim.
The virtual machines that have reclaimable capacity are highlighted.
g Click the gear icon, and select Set CPU Count and Memory for VM.
h Click the Current CPU column title to sort the list according to the highest number of CPUs.
Based on the actual use of the virtual machines listed, the New CPU column recommends fewer
CPUs for each virtual machine.
i Click the check box next to each virtual machine that has a recommended lower CPU count, and
click OK.
By reducing the number of CPUs for each virtual machine, you free up capacity on your host
system, and improve the USA-Cluster capacity and workload.
4 Examine the heatmaps for the host system and virtual machine objects in USA-Cluster.
a In the inventory tree, click USA-Cluster.
b Click Details, click Heatmaps, and click through the list of heatmap views.
c Click Which VMs currently have the highest CPU demand and contention?
The heatmap displays blocks that represent the objects in USA-Cluster. The block for a virtual
machine appears in red, which indicates that it has a critical problem.
d Hover over the red block and examine the details.
The cluster, host system, and virtual machine names appear, with links to more information about
the object.
e Click Show Sparkline to display the activity trend on the virtual machine.
f Click each of the Details links to display more information.
To verify that freeing up memory on the virtual machines has improved the workload of the host system
and the cluster, you can now examine the status of the host system and cluster.
You used views and heatmaps to evaluate the status of your objects and identify trends and spikes, and free
up capacity for your host system and USA-Cluster. To further narrow in on problems, you can examine the
other views and heatmaps. You can also create your own views and heatmaps.
What to do next
Examine the badge status for the objects in your environment hierarchy to determine which objects are in a
critical state, and examine the object relationships to determine whether a problem on one object is aecting
one or more other objects. See “Examine the Environment Relationships,” on page 26.
Examine the Environment Relationships
You use the Environment Overview and List to examine the status of the badges as they relate to the objects
in your environment hierarchy, and determine which objects are in a critical state for a particular badge. To
view the relationships between your objects to determine whether an ancestor object that has a critical
problem might be causing problems with the descendants of the object, you use the Environment Map.
As you click each of the badges in the Environment Overview, you see that several objects are experiencing
critical problems with health, workload, and faults. Others are reporting critical risk status, and many are in
critical time remaining and capacity remaining states.
vRealize Operations Manager User Guide
26 VMware, Inc.