
6.4
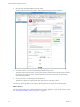
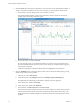
Table Of Contents
- vRealize Operations Manager User Guide
- Contents
- About This User Guide
- Monitoring Objects in Your Managed Environment
- What to Do When...
- User Scenario: A User Calls With a Problem
- User Scenario: An Alert Arrives in Your Inbox
- Respond to an Alert in Your Email
- Evaluate Other Triggered Symptoms for the Affected Data Store
- Compare Alerts and Events Over Time in Response to a Datastore Alert
- View the Affected Datastore in Relation to Other Objects
- Construct Metric Charts to Investigate the Cause of the Data Store Alert
- Run a Recommendation On a Datastore to Resolve an Alert
- User Scenario: You See Problems as You Monitor the State of Your Objects
- Monitoring and Responding to Alerts
- Monitoring and Responding to Problems
- Evaluating Object Summary Information
- Investigating Object Alerts
- Evaluating Metric Information
- Analyzing the Resources in Your Environment
- Using Troubleshooting Tools to Resolve Problems
- Creating and Using Object Details
- Examining Relationships in Your Environment
- User Scenario: Investigate the Root Cause a Problem Using Troubleshooting Tab Options
- Running Actions from vRealize Operations Manager
- List of vRealize Operations Manager Actions
- Working With Actions That Use Power Off Allowed
- Actions Supported for Automation
- Integration of Actions with vRealize Automation
- Run Actions From Toolbars in vRealize Operations Manager
- Troubleshoot Actions in vRealize Operations Manager
- Monitor Recent Task Status
- Troubleshoot Failed Tasks
- Determine If a Recent Task Failed
- Troubleshooting Maximum Time Reached Task Status
- Troubleshooting Set CPU or Set Memory Failed Tasks
- Troubleshooting Set CPU Count or Set Memory with Powered Off Allowed
- Troubleshooting Set CPU Count and Memory When Values Not Supported
- Troubleshooting Set CPU Resources or Set Memory Resources When the Value is Not Supported
- Troubleshooting Set CPU Resources or Set Memory Resources When the Value is Too High
- Troubleshooting Set Memory Resources When the Value is Not Evenly Divisible by 1024
- Troubleshooting Failed Shut Down VM Action Status
- Troubleshooting VMware Tools Not Running for a Shut Down VM Action Status
- Troubleshooting Failed Delete Unused Snapshots Action Status
- Viewing Your Inventory
- What to Do When...
- Planning the Capacity for Your Managed Environment
- Index
You have analyzed the symptoms, timeline, events, and metrics related to the problems on your cluster, and
determined that the heavy workload on the cluster has decreased the cluster density in the last several days,
which indicates that the cluster is starting to run out of capacity.
What to do next
Examine the Details views and heatmaps to interpret the properties, metrics, and alerts to look for trends
and spikes that occur in the resources for your objects, the distributions of resources across your objects, and
data maps to examine the use of various resource types across your objects. See “Examine the Environment
Details,” on page 25.
Examine the Environment Details
Examine the status of your objects in the views and heatmaps so that you can identify the trends and spikes
that are occurring with the resources on your cluster and objects. To determine whether any deviations have
occurred, you can display overall summaries for an object, such as for the cluster disk space usage
breakdown.
To examine the problems with your USA-Cluster further, use the Details views to display the metrics and
collected capacity data for your cluster. Each view includes specic metrics data collected from your objects.
For example, trend views use data collected from objects over time to generate trends and forecasts for
resources such as memory, CPU, disk space, and so on.
Use the heatmaps to examine the capacity levels on the cluster, host systems, and virtual machines. The
block sizes and colors are based on the metrics selected in the heatmap conguration. For example, the
heatmap that shows the most abnormal workload for virtual machines is sized by the Badge|Workload (%)
metric, and is colored by the Badge|Anomaly metric.
Prerequisites
Use the Troubleshooting tabs to look for root causes. See “Troubleshoot Problems with a Host System,” on
page 23
Procedure
1 Click Environment > vSphere Hosts and Clusters > USA-Cluster.
2 Examine the detailed information about USA-Cluster in the views.
a Click the Details tab and click Views.
The views provide multiple ways to look at dierent types of collected data by using trends, lists,
distributions, and summaries.
b In the search text box, enter capacity.
The list lters and displays the capacity views for clusters and other objects.
c Click the view named Cluster Capacity Risk Forecast, and examine the number of virtual
machines for USA-Cluster in the lower pane.
Even though the USA-Cluster has two host systems and 30 virtual machines, no capacity exists.
3 Examine the host systems in the cluster, and reclaim capacity from the descendant virtual machines.
a Click the Analysis tab, and click Capacity Remaining.
b In the inventory tree, expand USA-Cluster, and click each of the host systems.
The host system named w2-vcopsqe2-009 is in a critical state, with no capacity remaining.
c In the lower pane, expand Memory, and expand Allocation.
The stress free value is zero, and the amount of memory available is zero, which indicates that the
capacity of the host system has been depleted.
Chapter 1 Monitoring Objects in Your Managed Environment by Using vRealize Operations Manager
VMware, Inc. 25