
6.4
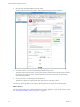
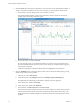
Table Of Contents
- vRealize Operations Manager User Guide
- Contents
- About This User Guide
- Monitoring Objects in Your Managed Environment
- What to Do When...
- User Scenario: A User Calls With a Problem
- User Scenario: An Alert Arrives in Your Inbox
- Respond to an Alert in Your Email
- Evaluate Other Triggered Symptoms for the Affected Data Store
- Compare Alerts and Events Over Time in Response to a Datastore Alert
- View the Affected Datastore in Relation to Other Objects
- Construct Metric Charts to Investigate the Cause of the Data Store Alert
- Run a Recommendation On a Datastore to Resolve an Alert
- User Scenario: You See Problems as You Monitor the State of Your Objects
- Monitoring and Responding to Alerts
- Monitoring and Responding to Problems
- Evaluating Object Summary Information
- Investigating Object Alerts
- Evaluating Metric Information
- Analyzing the Resources in Your Environment
- Using Troubleshooting Tools to Resolve Problems
- Creating and Using Object Details
- Examining Relationships in Your Environment
- User Scenario: Investigate the Root Cause a Problem Using Troubleshooting Tab Options
- Running Actions from vRealize Operations Manager
- List of vRealize Operations Manager Actions
- Working With Actions That Use Power Off Allowed
- Actions Supported for Automation
- Integration of Actions with vRealize Automation
- Run Actions From Toolbars in vRealize Operations Manager
- Troubleshoot Actions in vRealize Operations Manager
- Monitor Recent Task Status
- Troubleshoot Failed Tasks
- Determine If a Recent Task Failed
- Troubleshooting Maximum Time Reached Task Status
- Troubleshooting Set CPU or Set Memory Failed Tasks
- Troubleshooting Set CPU Count or Set Memory with Powered Off Allowed
- Troubleshooting Set CPU Count and Memory When Values Not Supported
- Troubleshooting Set CPU Resources or Set Memory Resources When the Value is Not Supported
- Troubleshooting Set CPU Resources or Set Memory Resources When the Value is Too High
- Troubleshooting Set Memory Resources When the Value is Not Evenly Divisible by 1024
- Troubleshooting Failed Shut Down VM Action Status
- Troubleshooting VMware Tools Not Running for a Shut Down VM Action Status
- Troubleshooting Failed Delete Unused Snapshots Action Status
- Viewing Your Inventory
- What to Do When...
- Planning the Capacity for Your Managed Environment
- Index

5 Click the Events tab to examine the changes that occurred on USA-Cluster, and determine whether a
change occurred that contributed to the root cause of the alert or other problems with the cluster.
a On the toolbar, click each badge and view the events that occurred.
The Workload badge displays a graph of the events that occurred on the cluster. Several red
triangles appear at various points in the graph.
b Hover your mouse over each red triangle.
By reviewing the graph, you can determine whether a reoccurring event has caused the errors.
Each event indicates that the guest le system is out of disk space. The aected objects appear in
the pane below the graph.
c Click each red triangle to identify the aected object and highlight it in the pane below.
6 Click the All Metrics tab to evaluate the objects in their context in the environment topology to help
identify the possible cause of a problem.
a In the top view, select USA-Cluster.
b In the metrics pane, expand Badge and double-click Badge|Capacity Remaining (%).
The Badge|Capacity Remaining (%) calculation is added to the lower right pane.
c In the metrics pane, double-click Density.
d In the metrics pane, double-click Workload.
e On the toolbar, click Date Controls and select Last 7 Days.
The metric chart indicates that the capacity for the cluster remained at a steady level for the past
week, but that the cluster density increased to its maximum value in the last several days. The
Badge|Workload (%) calculation displays the workload extremes that correspond to the density
problem.
vRealize Operations Manager User Guide
24 VMware, Inc.