
6.4
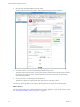
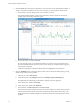
Table Of Contents
- vRealize Operations Manager User Guide
- Contents
- About This User Guide
- Monitoring Objects in Your Managed Environment
- What to Do When...
- User Scenario: A User Calls With a Problem
- User Scenario: An Alert Arrives in Your Inbox
- Respond to an Alert in Your Email
- Evaluate Other Triggered Symptoms for the Affected Data Store
- Compare Alerts and Events Over Time in Response to a Datastore Alert
- View the Affected Datastore in Relation to Other Objects
- Construct Metric Charts to Investigate the Cause of the Data Store Alert
- Run a Recommendation On a Datastore to Resolve an Alert
- User Scenario: You See Problems as You Monitor the State of Your Objects
- Monitoring and Responding to Alerts
- Monitoring and Responding to Problems
- Evaluating Object Summary Information
- Investigating Object Alerts
- Evaluating Metric Information
- Analyzing the Resources in Your Environment
- Using Troubleshooting Tools to Resolve Problems
- Creating and Using Object Details
- Examining Relationships in Your Environment
- User Scenario: Investigate the Root Cause a Problem Using Troubleshooting Tab Options
- Running Actions from vRealize Operations Manager
- List of vRealize Operations Manager Actions
- Working With Actions That Use Power Off Allowed
- Actions Supported for Automation
- Integration of Actions with vRealize Automation
- Run Actions From Toolbars in vRealize Operations Manager
- Troubleshoot Actions in vRealize Operations Manager
- Monitor Recent Task Status
- Troubleshoot Failed Tasks
- Determine If a Recent Task Failed
- Troubleshooting Maximum Time Reached Task Status
- Troubleshooting Set CPU or Set Memory Failed Tasks
- Troubleshooting Set CPU Count or Set Memory with Powered Off Allowed
- Troubleshooting Set CPU Count and Memory When Values Not Supported
- Troubleshooting Set CPU Resources or Set Memory Resources When the Value is Not Supported
- Troubleshooting Set CPU Resources or Set Memory Resources When the Value is Too High
- Troubleshooting Set Memory Resources When the Value is Not Evenly Divisible by 1024
- Troubleshooting Failed Shut Down VM Action Status
- Troubleshooting VMware Tools Not Running for a Shut Down VM Action Status
- Troubleshooting Failed Delete Unused Snapshots Action Status
- Viewing Your Inventory
- What to Do When...
- Planning the Capacity for Your Managed Environment
- Index
5 Fix the Problem on page 28
You use the analysis and troubleshooting features of vRealize Operations Manager to examine
problems that put your objects in a critical state, and identify solutions. To resolve the problems,
where actions exist for the object type, you select an object and an available action that is specic to the
object. Or, you can open the object in the vSphere Web Client and modify the object seings to resolve
the problem.
6 Create a New Alert Denition on page 30
Based on the root cause of the problem, and the solutions that you used to x the problem, you can
create a new alert denition for vRealize Operations Manager to alert you. When the alert is triggered
on your host system, vRealize Operations Manager alerts you and provides recommendations on how
to solve the problem.
7 Create Dashboards and Views on page 31
To help you investigate and troubleshoot problems with your cluster and host systems that might
occur in the future, you can create dashboards and views that apply the troubleshooting tools and
solutions that you used to research and solve the problems with your host system, to make those
troubleshooting tools and solutions available for future use.
Analyze the State of Your Environment
The Analysis tabs help you analyze your objects in multiple ways. As a Virtual Infrastructure Administrator,
you use the Analysis tabs to evaluate the details about the state of your objects to help you resolve problems.
As you browse through the inventory tree, you notice that one of your clusters, named USA-Cluster, is
experiencing capacity problems. You use the Analysis tabs to begin to investigate the cause of the problem
on USA-Cluster, and you start to see problems reported with the capacity on one of your host systems and
other objects.
Prerequisites
Verify that you understand the context of this scenario. See “User Scenario: You See Problems as You
Monitor the State of Your Objects,” on page 19.
Procedure
1 Click Environment > vSphere Hosts and Clusters > USA-Cluster.
2 Click the Analysis tab.
You see red icons on the Capacity Remaining and Time Remaining tabs.
3 Click the Time Remaining tab.
You see that the memory allocation is severely constrained.
Chapter 1 Monitoring Objects in Your Managed Environment by Using vRealize Operations Manager
VMware, Inc. 21