
6.3

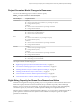
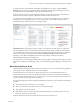
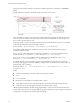
Table Of Contents
- vRealize Operations Manager User Guide
- Contents
- About This User Guide
- Monitoring Objects in Your Managed Environment
- What to Do When...
- User Scenario: A User Calls With a Problem
- User Scenario: An Alert Arrives in Your Inbox
- Respond to an Alert in Your Email
- Evaluate Other Triggered Symptoms for the Affected Data Store
- Compare Alerts and Events Over Time in Response to a Datastore Alert
- View the Affected Datastore in Relation to Other Objects
- Construct Metric Charts to Investigate the Cause of the Data Store Alert
- Run a Recommendation On a Datastore to Resolve an Alert
- User Scenario: You See Problems as You Monitor the State of Your Objects
- Monitoring and Responding to Alerts
- Monitoring and Responding to Problems
- Evaluating Object Summary Information
- Investigating Object Alerts
- Analyzing the Resources in Your Environment
- Using Troubleshooting Tools to Resolve Problems
- Creating and Using Object Details
- Examining Relationships in Your Environment
- Running Actions from vRealize Operations Manager
- List of vRealize Operations Manager Actions
- Working With Actions That Use Power Off Allowed
- Actions Supported for Automation
- Integration of Actions with vRealize Automation
- Run Actions From Toolbars in vRealize Operations Manager
- Troubleshoot Actions in vRealize Operations Manager
- Monitor Recent Task Status
- Troubleshoot Failed Tasks
- Determine If a Recent Task Failed
- Troubleshooting Maximum Time Reached Task Status
- Troubleshooting Set CPU or Set Memory Failed Tasks
- Troubleshooting Set CPU Count or Set Memory with Powered Off Allowed
- Troubleshooting Set CPU Count and Memory When Values Not Supported
- Troubleshooting Set CPU Resources or Set Memory Resources When the Value is Not Supported
- Troubleshooting Set CPU Resources or Set Memory Resources When the Value is Too High
- Troubleshooting Set Memory Resources When the Value is Not Evenly Divisible by 1024
- Troubleshooting Failed Shut Down VM Action Status
- Troubleshooting VMware Tools Not Running for a Shut Down VM Action Status
- Troubleshooting Failed Delete Unused Snapshots Action Status
- Viewing Your Inventory
- What to Do When...
- Planning the Capacity for Your Managed Environment
- Index

In the policy stress analysis seings, to examine an example graph used to calculate stress, click What is
stress?.
Another example to explain the calculation used for CPU stress is shown here.
With a peak detection window size of 60 minutes, vRealize Operations Manager calculates the CPU stress
score. It uses the area under the demand curve and above the stress threshold line as a percentage of the
area covered by the total capacity curve.
Using time stamps of t1 and t2 to identify a 60-minute window in the last 30 days, the stress score depends
on demand, stress threshold, and total capacity over time.
Maximum((Demand - Stress Threshold) ÷ (Total Capacity - Stress Threshold))
This equation applies to the stress calculations for each resource, such as memory demand, memory
consumed, and CPU demand.
If Total Capacity varies during the time range being considered, Stress Threshold must also become
variable, because (Stress Threshold) = (Stress Threshold in %) × (Total Capacity).
Since (Total Capacity) can be a dierent value at a dierent time, as identied by t, then “Stress
Threshold”(t) = “Stress Threshold in %” × “Total Capacity”(t).
As a result, the Stress score is the highest aggregate of demand that exceeds 70 percent of capacity, as a
percentage of the aggregate of capacity within any contiguous interval of 60 minutes in the last 30 days. In
formula for the score is as follows:
Maximum((Demand(t1, t2) - “Stress Threshold”(t1, t2)) ÷ (“Total Capacity”(t1, t2) – “Stress
Threshold”(t1, t2)))
Where:
n
t1 and t2 are time stamps in the time continuum within the last 30 days.
n
t1 < t2
n
t2 - t1 = 60 minutes
n
Demand(t1, t2) is the demand curve between time t1 and t2.
n
“Stress Threshold”(t1, t2) is the stress threshold curve (as absolute values) between time t1 and t2.
n
“Total Capacity”(t1, t2) is the capacity threshold curve between time t1 and t2.
vRealize Operations Manager calculates the aggregate during a contiguous time interval of 60 minutes in
the last 30 days. The Stress score is the percentage of aggregate capacity in the same contiguous time interval
of 60 minutes. An acceptable score yields a green Stress badge.
vRealize Operations Manager User Guide
78 VMware, Inc.