
6.3

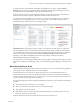
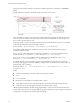
Table Of Contents
- vRealize Operations Manager User Guide
- Contents
- About This User Guide
- Monitoring Objects in Your Managed Environment
- What to Do When...
- User Scenario: A User Calls With a Problem
- User Scenario: An Alert Arrives in Your Inbox
- Respond to an Alert in Your Email
- Evaluate Other Triggered Symptoms for the Affected Data Store
- Compare Alerts and Events Over Time in Response to a Datastore Alert
- View the Affected Datastore in Relation to Other Objects
- Construct Metric Charts to Investigate the Cause of the Data Store Alert
- Run a Recommendation On a Datastore to Resolve an Alert
- User Scenario: You See Problems as You Monitor the State of Your Objects
- Monitoring and Responding to Alerts
- Monitoring and Responding to Problems
- Evaluating Object Summary Information
- Investigating Object Alerts
- Analyzing the Resources in Your Environment
- Using Troubleshooting Tools to Resolve Problems
- Creating and Using Object Details
- Examining Relationships in Your Environment
- Running Actions from vRealize Operations Manager
- List of vRealize Operations Manager Actions
- Working With Actions That Use Power Off Allowed
- Actions Supported for Automation
- Integration of Actions with vRealize Automation
- Run Actions From Toolbars in vRealize Operations Manager
- Troubleshoot Actions in vRealize Operations Manager
- Monitor Recent Task Status
- Troubleshoot Failed Tasks
- Determine If a Recent Task Failed
- Troubleshooting Maximum Time Reached Task Status
- Troubleshooting Set CPU or Set Memory Failed Tasks
- Troubleshooting Set CPU Count or Set Memory with Powered Off Allowed
- Troubleshooting Set CPU Count and Memory When Values Not Supported
- Troubleshooting Set CPU Resources or Set Memory Resources When the Value is Not Supported
- Troubleshooting Set CPU Resources or Set Memory Resources When the Value is Too High
- Troubleshooting Set Memory Resources When the Value is Not Evenly Divisible by 1024
- Troubleshooting Failed Shut Down VM Action Status
- Troubleshooting VMware Tools Not Running for a Shut Down VM Action Status
- Troubleshooting Failed Delete Unused Snapshots Action Status
- Viewing Your Inventory
- What to Do When...
- Planning the Capacity for Your Managed Environment
- Index
In vRealize Operations Manager, stress involves how high and how long the demand persists relative to the
capacity available, and vRealize Operations Manager uses this value to measure the potential for
performance problems. The higher the stress score, the worse the potential is for degraded performance on
your objects. Depending on the conguration of the policy analysis seings for stress, a score of green might
indicate 0–24 percent of stress. A score of red might indicate more than 50 percent of stress. With the ve-
minute data collections and the intelligent stress calculations, vRealize Operations Manager can easily
identify periods of poor performance.
Demand drives stress. vRealize Operations Manager bases the calculations for right-sizing capacity on past
demand. The goal of right-sizing is to produce a green level of stress, marked by a green Stress badge.
Usable capacity is equal to the total capacity available minus any buers that administrators or users
dened. To measure the right-sized amounts of usable capacity, the capacity calculations use what is called a
stress-free value. Using the demand, stress, and the stress-free value, vRealize Operations Manager
calculates the right size.
The capacity analytics determine the actual and eective demand for resources based on having no
contention. The calculations consider the capacity to be unlimited and free of contention for resources,
which results in no stress on the available capacity. The result is called the stress-free demand or the stress-
free value.
Where to Find Stress-Free Demand and Stress-Free Value
In some areas of the user interface, vRealize Operations Manager identies capacity as Stress Free Demand,
and in other areas it is identied as Stress Free Value. Both terms mean that the calculated capacity for an
object is free from unacceptable levels of contention and stress, as dened in the policy for the Stress score.
Stress Free Demand appears in Troubleshooting > All Metrics, Views, and Reports.
n
In Troubleshooting > All Metrics, you can use the metric named Stress Free Demand to examine the
CPU demand, disk space allocation and demand, memory consumed, and the vSphere conguration
limit on an object. When you apply this metric to these resources, you can build a metric graph to
display the stress-free demand for an object. The graph displays the high and low stress-free capacity
values over time.
n
In Content > Views, when you add or edit a view, in the Data and Conguration areas of the
workspace, you can use the metric named Stress Free Demand. Use this metric to build views for CPU
demand, disk space allocation and demand, memory consumed, and the vSphere conguration limit.
n
In Content > Reports, you can use a view that includes the metric named Stress Free Demand to
generate a report. The table in the report displays Stress Free Demand as the label. For example, this
metric appears in the report named Cluster CPU Demand (%) Trend View.
Stress Free Value appears on the Object > Analysis > Time Remaining tab, and on the Object > Analysis >
Stress tab.
n
On the Object > Analysis > Time Remaining tab, you can view the time remaining for CPU demand,
memory consumed, disk space demand and allocation, and the vSphere conguration limit. In this
view, the table column name is Stress Free Value.
n
On the Object > Analysis > Stress tab, the table column name is Stress Free Value. The tables display
Stress Free Value as the calculated values for CPU demand, memory consumed, and the vSphere
conguration limit.
Setting the Thresholds for the Stress Score
The analysis seings in the policy that you apply to your objects denes the thresholds for the stress score.
The policy includes default seings for the stress score to be green, yellow, orange, or red. If the seings are
too strict or loose for your environment, you can modify them.
vRealize Operations Manager User Guide
76 VMware, Inc.