
6.3
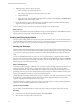
Table Of Contents
- vRealize Operations Manager User Guide
- Contents
- About This User Guide
- Monitoring Objects in Your Managed Environment
- What to Do When...
- User Scenario: A User Calls With a Problem
- User Scenario: An Alert Arrives in Your Inbox
- Respond to an Alert in Your Email
- Evaluate Other Triggered Symptoms for the Affected Data Store
- Compare Alerts and Events Over Time in Response to a Datastore Alert
- View the Affected Datastore in Relation to Other Objects
- Construct Metric Charts to Investigate the Cause of the Data Store Alert
- Run a Recommendation On a Datastore to Resolve an Alert
- User Scenario: You See Problems as You Monitor the State of Your Objects
- Monitoring and Responding to Alerts
- Monitoring and Responding to Problems
- Evaluating Object Summary Information
- Investigating Object Alerts
- Analyzing the Resources in Your Environment
- Using Troubleshooting Tools to Resolve Problems
- Creating and Using Object Details
- Examining Relationships in Your Environment
- Running Actions from vRealize Operations Manager
- List of vRealize Operations Manager Actions
- Working With Actions That Use Power Off Allowed
- Actions Supported for Automation
- Integration of Actions with vRealize Automation
- Run Actions From Toolbars in vRealize Operations Manager
- Troubleshoot Actions in vRealize Operations Manager
- Monitor Recent Task Status
- Troubleshoot Failed Tasks
- Determine If a Recent Task Failed
- Troubleshooting Maximum Time Reached Task Status
- Troubleshooting Set CPU or Set Memory Failed Tasks
- Troubleshooting Set CPU Count or Set Memory with Powered Off Allowed
- Troubleshooting Set CPU Count and Memory When Values Not Supported
- Troubleshooting Set CPU Resources or Set Memory Resources When the Value is Not Supported
- Troubleshooting Set CPU Resources or Set Memory Resources When the Value is Too High
- Troubleshooting Set Memory Resources When the Value is Not Evenly Divisible by 1024
- Troubleshooting Failed Shut Down VM Action Status
- Troubleshooting VMware Tools Not Running for a Shut Down VM Action Status
- Troubleshooting Failed Delete Unused Snapshots Action Status
- Viewing Your Inventory
- What to Do When...
- Planning the Capacity for Your Managed Environment
- Index
What to do next
To see metric level details for the virtual machine, you can build your own charts. See “Create Metric Charts
When You Troubleshoot a Virtual Machine Problem,” on page 49.
Create Metric Charts When You Troubleshoot a Virtual Machine Problem
You create a custom group of metric charts when you troubleshoot a problem with a virtual machine so that
you can compare dierent metrics. The level of detail that you can create using the All Metrics tab in
vRealize Operations Manager can contribute signicantly to your eort to nd the root cause of a problem.
As a virtual infrastructure administrator investigating a reported performance problem with a virtual
machine, you determined that you need to see detailed charts about the following reported symptoms.
n
Guest le system overall disk space usage reaching critical limit
n
Guest partition disk space usage
The following method of evaluating problems using the All Metrics tab is provided as an example for using
vRealize Operations Manager and is not denitive. Your troubleshooting skills and your knowledge of the
particulars of your environment determine which methods work for you.
Prerequisites
Compare events and badges metrics. See “Identify Inuential Events When You Troubleshoot a Virtual
Machine Problem,” on page 48.
Procedure
1 Enter the name of the virtual machine in the Search text box, located on the main title bar.
In this example, the virtual machine name is sales-10-dk.
2 Click the Troubleshooting tab and click the All Metrics tab.
3 In the relationship topology map, click the virtual machine, dk-new-10.
The metrics list, located in the lower left of the center pane, displays virtual machine metrics.
4 On the chart toolbar, click Date Control and select a time that is on or before the symptoms were
triggered.
5 Add metric charts to the display area for the virtual machine.
a In the metric list, select Guest Files System Stats > Total Guest File System Free (GB) and double-
click the metric name.
b To add the guest partition, for example, C:\, select Guest Files System Stats > C:\ > Guest File
System Free (GB) and double-click the metric name.
c To add disk space for comparison, select Disk Space > Capacity Remaining (%) and double-click
the metric name.
6 Compare the charts.
A comparison of the charts shows a similar decrease in the le system free space, and that the virtual
machine disk space capacity remaining is decreasing at a steady rate. You determine that you must add
disk space to the virtual machine, but you do not know if the datastore can support the change to the
virtual machine.
Chapter 1 Monitoring Objects in Your Managed Environment by Using vRealize Operations Manager
VMware, Inc. 49