
6.3
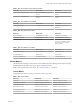
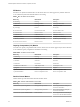
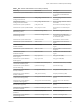
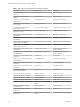
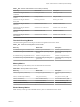
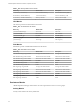
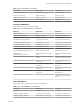
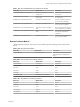
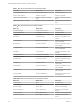
Table Of Contents
- vRealize Operations Definitions for Metrics, Properties, and Alerts
- Contents
- About vRealize Operations Manager Reference for Metrics, Properties, and Alerts
- Metric Definitions in vRealize Operations Manager
- Property Definitions in vRealize Operations Manager
- Alert Definitions in vRealize Operations Manager
- Cluster Compute Resource Alert Definitions
- Host System Alert Definitions
- vSphere Distributed Port Group
- Virtual Machine Alert Definitions
- vSphere Distributed Switch Alert Definitions
- vCenter Server Alert Definitions
- Datastore Alert Definitions
- Data Center Alert Definitions
- Custom Data Center Alert Definitions
- Index

DT Metrics
DT metrics are dynamic threshold metrics for the cluster. Non-zero values appear only if metric collection
occurs while the dynamic threshold calculations are running.
Table 1‑127. DT Metrics for the Cluster
Metric Key Metric Name Description
dt|isRunning Running Running
dt|dtRunTime Running duration Running duration (ms)
dt|StartTime Running start time Running start time
dt|percentage Percent Percent (%)
dt|executorCount Executor Node Count Executor Node Count
dt|resourceCount Resource Count Resource Count
dt|fsdbReadTime FSDB Read Time FSDB Read Time (ms)
dt|dtObjectSaveTime DT Object Save Time DT Object Save Time (ms)
dt|dtHistorySaveTime DT History Save Time DT History Save Time (ms)
dt|executor|resourceCount Resource Count Resource Count
Capacity Computation (CC) Metrics
CC metrics are capacity computation metrics for the cluster. Non-zero values appear only if metric collection
occurs while the capacity computation calculations are running.
Table 1‑128. CC Metrics for the Cluster
Metric Key Metric Name Description
cc|isRunning Running Running
cc|runTime Total Run Time Total Run Time
cc|startTime Start time Start time
cc|nishTime Finish Time Finish Time
cc|totalResourcesToProcess Total Objects Count Total Objects Count
cc|progress Progress Progress
cc|phase1TimeTaken Phase 1 Computation Time Phase 1 Computation Time
cc|phase2TimeTaken Phase 2 Computation Time Phase 2 Computation Time
Gemfire Cluster Metrics
Gemre metrics provide information about the Gemre cluster.
Table 1‑129. Gemfire cluster Metrics for the Cluster
Metric Key Metric Name Description
GemreCluster|System|AvgReads Average reads per second The average number of reads per
second for all members
GemreCluster|System|AvgWrites Average writes per second The average number of writes per
second for all members
GemreCluster|System|DiskReadsRate Disk reads rate The average number of disk reads per
second across all distributed members
vRealize Operations Definitions for Metrics, Properties, and Alerts
82 VMware, Inc.