
6.3


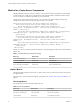
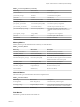
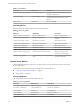
Table Of Contents
- vRealize Operations Definitions for Metrics, Properties, and Alerts
- Contents
- About vRealize Operations Manager Reference for Metrics, Properties, and Alerts
- Metric Definitions in vRealize Operations Manager
- Property Definitions in vRealize Operations Manager
- Alert Definitions in vRealize Operations Manager
- Cluster Compute Resource Alert Definitions
- Host System Alert Definitions
- vSphere Distributed Port Group
- Virtual Machine Alert Definitions
- vSphere Distributed Switch Alert Definitions
- vCenter Server Alert Definitions
- Datastore Alert Definitions
- Data Center Alert Definitions
- Custom Data Center Alert Definitions
- Index

Metrics for vCenter Server Components
vRealize Operations Manager connects to VMware vCenter Server
®
instances through the vCenter adapter
to collect metrics for vCenter Server components and uses formulas to derive statistics from those metrics.
You can use metrics to troubleshoot problems in your environment.
vCenter Server components are listed in the describe.xml le for the vCenter adapter. The following
example shows sensor metrics for the host system in the describe.xml le.
<ResourceGroup instanced="false" key="Sensor" nameKey="1350" validation="">
<ResourceGroup instanced="false" key="fan" nameKey="1351" validation="">
<ResourceAttribute key="currentValue" nameKey="1360" dashboardOrder="1"
dataType="float" defaultMonitored="false" isDiscrete="false" isRate="false" maxVal=""
minVal="" unit="percent"/>
<ResourceAttribute key="healthState" nameKey="1361" dashboardOrder="1" dataType="float"
defaultMonitored="false" isDiscrete="false" isRate="false" maxVal="" minVal="" />
</ResourceGroup>
<ResourceGroup instanced="false" key="temperature" nameKey="1352" validation="">
<ResourceAttribute key="currentValue" nameKey="1362" dashboardOrder="1"
dataType="float" defaultMonitored="false" isDiscrete="false" isRate="false" maxVal=""
minVal="" />
<ResourceAttribute key="healthState" nameKey="1363" dashboardOrder="1" dataType="float"
defaultMonitored="false" isDiscrete="false" isRate="false" maxVal="" minVal="" />
</ResourceGroup>
</ResourceGroup>
Each ResourceAttribute element includes the name of a metric that appears in the UI and is documented as
a Metric Key.
Table 1‑1. Sensor Metrics for Host System Cooling
Metric Key Metric Name Description
Sensor|fan|currentValue Speed Fan speed.
Sensor|fan|healthState Health State Fan health state.
Sensor|temperature|currentValue Temperature Host system temperature.
Sensor|temperature|healthState Health State Host system health state.
vSphere Metrics
vRealize Operations Manager collects CPU use, disk, memory, network, and summary metrics for objects in
the vSphere world.
Capacity metrics can be calculated for vSphere world objects. See “Capacity and Project-Based Metrics,” on
page 62.
CPU Usage Metrics
CPU usage metrics provide information about CPU use.
Table 1‑2. CPU Usage Metrics
Metric Key Metric Name Description
cpu|capacity_usagepct_average Capacity Usage Percent capacity used.
cpu|capacity_contentionPct CPU Contention Percent CPU contention.
cpu|demandPct Demand (%) CPU demand percentage.
vRealize Operations Definitions for Metrics, Properties, and Alerts
8 VMware, Inc.