
6.3
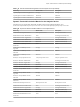
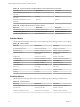
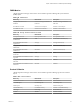
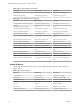
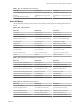
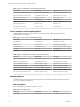
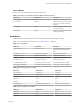
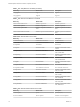
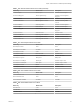
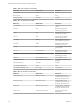
Table Of Contents
- vRealize Operations Definitions for Metrics, Properties, and Alerts
- Contents
- About vRealize Operations Manager Reference for Metrics, Properties, and Alerts
- Metric Definitions in vRealize Operations Manager
- Property Definitions in vRealize Operations Manager
- Alert Definitions in vRealize Operations Manager
- Cluster Compute Resource Alert Definitions
- Host System Alert Definitions
- vSphere Distributed Port Group
- Virtual Machine Alert Definitions
- vSphere Distributed Switch Alert Definitions
- vCenter Server Alert Definitions
- Datastore Alert Definitions
- Data Center Alert Definitions
- Custom Data Center Alert Definitions
- Index

Service Metrics
Service metrics provide information about watchdog activity.
Table 1‑110. Metrics for the vRealize Operations Manager Watchdog Service
Metric Key Metric Name Description
Service|Enabled Enabled Enabled
Service|Restarts Restarts Number of times the process has been
unresponsive and been restarted by
Watchdog.
Service|Starts Starts Number of times the process has been
revived by Watchdog.
Service|Stops Stops Number of times the process has been
stopped by Watchdog.
Node Metrics
vRealize Operations Manager collects metrics for the vRealize Operations Manager node objects.
Metrics can be calculated for node objects. See “Calculated Metrics,” on page 62.
Table 1‑111. Node Metrics
Metric Key Metric Name Description
Component Count Component count The number of vRealize Operations
Manager objects reporting for this
node
PrimaryResourcesCount Number of primary objects Number of primary objects
LocalResourcesCount Number of local objects Number of local objects
PrimaryMetricsCount Number of primary metrics Number of primary metrics
LocalMetricsCount Number of local metrics Number of local metrics
PercentDBStorageAvailable Percent disk available /storage/db Percent disk available /storage/db
PercentLogStorageAvailable Percent disk available /storage/log Percent disk available /storage/log
Table 1‑112. Memory Metrics for the Node
Metric Key Metric Name Description
mem|actualFree Actual Free Actual Free
mem|actualUsed Actual Used Actual Used
mem|free Free Free )
mem|used Used Used
mem|total Total Total
mem|demand_gb Estimated memory demand Estimated memory demand
Table 1‑113. Swap Metrics for the Node
Metric Key Metric Name Description
swap|total Total Total
swap|free Free Free
swap|used Used Used
Chapter 1 Metric Definitions in vRealize Operations Manager
VMware, Inc. 77