
6.3
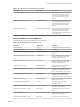
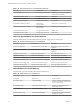
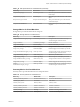
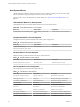
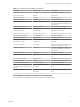
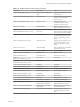
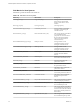
Table Of Contents
- vRealize Operations Definitions for Metrics, Properties, and Alerts
- Contents
- About vRealize Operations Manager Reference for Metrics, Properties, and Alerts
- Metric Definitions in vRealize Operations Manager
- Property Definitions in vRealize Operations Manager
- Alert Definitions in vRealize Operations Manager
- Cluster Compute Resource Alert Definitions
- Host System Alert Definitions
- vSphere Distributed Port Group
- Virtual Machine Alert Definitions
- vSphere Distributed Switch Alert Definitions
- vCenter Server Alert Definitions
- Datastore Alert Definitions
- Data Center Alert Definitions
- Custom Data Center Alert Definitions
- Index

Table 1‑32. CPU Utilization for Resources Metrics for Host Systems
Metric Key Metric Name Description
rescpu|actav1_latest
rescpu|actav5_latest
rescpu|actav15_latest
rescpu|actpk1_latest
rescpu|actpk5_latest
rescpu|actpk15_latest
CPU Active (%) (interval) Average active time for the CPU over the past
minute, past ve minutes, and at one-minute,
ve-minute, and 15-minute peak active times.
rescpu|runav1_latest
rescpu|runav5_latest
rescpu|runav15_latest
rescpu|runpk1_latest
rescpu|runpk5_latest
rescpu|runpk15_latest
CPU Running (%) (interval) Average run time for the CPU over the past
minute, past ve minutes, past 15 minutes, and at
one-minute, ve-minute, and 15-minute peak
times.
rescpu|maxLimited1_latest
rescpu|maxLimited5_latest
rescpu|maxLimited15_latest
CPU Throled (%) (interval) Scheduling limit over the past minute, past ve
minutes, and past 15 minutes
rescpu|sampleCount_latest Group CPU Sample Count Group CPU sample count.
rescpu|samplePeriod_latest Group CPU Sample Period (ms) Group CPU sample period in milliseconds.
Datastore Metrics for Host Systems
Datastore metrics provide information about datastore use.
Table 1‑33. Datastore Metrics for Host Systems
Metric Key Metric Name Notes
datastore|demand_oio Outstanding IO requests OIO for datastore.
datastore|maxObserved_NumberRead Max Observed Reads per second Max observed average number of
read commands issued per second
during the collection interval.
datastore|maxObserved_Read Max Observed Read Rate Max observed rate of reading data
from the datastore.
datastore|maxObserved_NumberWrite Max Observed Writes per second Max observed average number of
write commands issued per second
during the collection interval.
datastore|maxObserved_Write Max Observed Write Rate Max observed rate of writing data
from the datastore.
datastore|maxObserved_OIO Max Observed Number of
Outstanding IO Operations
Max Observed Number of
Outstanding IO Operations.
datastore|commandsAveraged_average Commands Averaged Average number of commands
issued per second during the
collection interval.
datastore|oio Number of Outstanding IO
Operations
Number of outstanding IO
operations.
datastore|totalLatency_average Disk Command Latency (ms) The average amount of time taken
for a command from the perspective
of a Guest OS. This is the sum of
Kernel Command Latency and
Physical Device Command Latency.
datastore|usage_average Usage Average (KBps) Usage Average (KBps).
datastore|demand Demand Demand.
vRealize Operations Definitions for Metrics, Properties, and Alerts
28 VMware, Inc.