
6.3


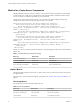
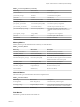
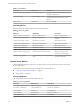
Table Of Contents
- vRealize Operations Definitions for Metrics, Properties, and Alerts
- Contents
- About vRealize Operations Manager Reference for Metrics, Properties, and Alerts
- Metric Definitions in vRealize Operations Manager
- Property Definitions in vRealize Operations Manager
- Alert Definitions in vRealize Operations Manager
- Cluster Compute Resource Alert Definitions
- Host System Alert Definitions
- vSphere Distributed Port Group
- Virtual Machine Alert Definitions
- vSphere Distributed Switch Alert Definitions
- vCenter Server Alert Definitions
- Datastore Alert Definitions
- Data Center Alert Definitions
- Custom Data Center Alert Definitions
- Index

Table 1‑5. Disk Metrics
Metric Key Metric Name Description
disk|commandsAveraged_average Commands per second Average number of commands issued per second
during the collection cycle.
disk|usage_average Usage Rate (KB per second) Average of the sum of the data read and wrien for
all of the disk instances of the host or virtual
machine.
disk|workload Workload (%) Percent of workload.
Summary Metrics
Summary metrics provide information about overall performance.
Table 1‑6. Summary Metrics
Metric Key Metric Name Description
summary|number_running_hosts Number of Running Hosts Number of running hosts.
summary|number_running_vms Number of Running VMs Number of running virtual
machines.
summary|total_number_clusters Total Number of Clusters Total number of clusters.
summary|total_number_datastores Total Number of Datastores Total number of datastores.
summary|total_number_hosts Total Number of Hosts Total number of hosts.
summary|total_number_vms Total Number of VMs Total number of virtual machines.
summary|total_number_datacenters Total Number of Datacenters Total number of data centers.
summary|number_running_vcpus Number VCPUs on Powered on VMs Number of virtual CPUs on
powered-on virtual machines.
summary|avg_vm_density Average Running VM Count per Running
Host
Average running virtual machine
count per running host.
vCenter Server Metrics
vRealize Operations Manager collects CPU use, disk, memory, network, and summary metrics for vCenter
Server system objects.
vCenter Server metrics include capacity and badge metrics. See denitions in:
n
“Capacity and Project-Based Metrics,” on page 62
n
“Badge Metrics,” on page 65
CPU Usage Metrics
CPU usage metrics provide information about CPU use.
Table 1‑7. CPU Usage Metrics
Metric Key Metric Name Description
cpu|capacity_usagepct_average Capacity Usage (%) Percent capacity used.
cpu|capacity_contentionPct CPU Contention (%) Percent CPU contention.
cpu|demandPct Demand (%) Percent demand.
cpu|demandmhz Demand (MHz) Demand in megaher.
cpu|demand_average Demand CPU Demand.
vRealize Operations Definitions for Metrics, Properties, and Alerts
10 VMware, Inc.