
6.3
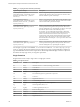
Table Of Contents
- vRealize Operations Manager Customization and Administration Guide
- Contents
- About Customization and Administration
- Configuring Users and Groups
- Customizing How vRealize Operations Manager Displays Your Data
- Customizing How vRealize Operations Manager Monitors Your Environment
- Defining Alerts in vRealize Operations Manager
- Object Relationship Hierarchies for Alert Definitions
- Alert Definition Best Practices
- Understanding Negative Symptoms for Alerts
- Create an Alert Definition for Department Objects
- Add Description and Base Object to Alert Definition
- Add a Virtual Machine CPU Usage Symptom to the Alert Definition
- Add a Host Memory Usage Symptom to the Alert Definition
- Add Recommendations to the Alert Definition
- Create a Custom Accounting Department Group
- Create a Policy for the Accounting Alert
- Configure Notifications for the Department Alert
- Create a Dashboard to Monitor Department Objects
- Defining Symptoms for Alerts
- Viewing Actions
- Defining Recommendations for Alert Definitions
- Creating and Managing Alert Notifications
- List of Outbound Plug-Ins
- Add Outbound Notification Plug-Ins
- Add a Standard Email Plug-In for Outbound Alerts
- Add a REST Plug-In for Outbound Alerts
- Add a Log File Plug-In for Outbound Alerts
- Add a Network Share Plug-In for vRealize Operations Manager Reports
- Add an SNMP Trap Plug-In for Outbound Alerts
- Add a Smarts Service Assurance Manager Notification Plug-In for Outbound Alerts
- Filtering Log File Outbound Messages With the TextFilter.xml File
- Configuring Notifications
- Defining Compliance Standards
- Operational Policies
- Managing and Administering Policies for vRealize Operations Manager
- Policy Decisions and Objectives
- Default Policy in vRealize Operations Manager
- Custom Policies
- Policies Provided with vRealize Operations Manager
- User Scenario: Create a Custom Operational Policy for a vSphere Production Environment
- User Scenario: Create an Operational Policy for Production vCenter Server Datastore Objects
- Create a Group Type for Your Datastore Objects
- Create an Object Group for Your Datastore Objects
- Create Your Policy and Select a Base Policy
- Override the Analysis Settings for the Datastore Objects
- Enable Disk Space Attributes for Datastore Objects
- Override Alert and Symptom Definitions for Datastore Objects
- Apply Your Datastore Policy to Your Datastore Objects Group
- Create a Dashboard for Disk Use of Your Datastore Objects
- Using the Monitoring Policy Workspace to Create and Modify Operational Policies
- Policy Workspace in vRealize Operations Manager
- Super Metrics in vRealize Operations Manager
- Customizing Icons
- Managing Objects in Your Environment
- Configuring Object Relationships
- Customizing How Endpoint Operations Management Monitors Operating Systems
- Modifying Global Settings
- Defining Alerts in vRealize Operations Manager
- Maintaining and Expanding vRealize Operations Manager
- Cluster and Node Maintenance
- Logging
- Passwords and Certificates
- How To Preserve Customized Content
- Backup and Restore
- OPS-CLI Command-Line Tool
- Index

Review Your Super Metric in Troubleshooting
After you assign your super metric to an object type, you can monitor it on the Troubleshooting tab of the
object type. Tracking a single super metric on one Troubleshooting tab is easier than tracking the metrics of
separate objects on several Troubleshooting tabs.
The super metric SM-AvgVMCPUUsage% you dened to calculate average CPU usage across all virtual machines
is assigned to the Host System object type. After one collection cycle has completed, SM-AvgVMCPUUsage%
appears as a super metric on each host.
Prerequisites
n
Create or import your super metric. See “Add Your Super Metric,” on page 106.
n
Visualize your super metric to verify that it works properly. See “Visualize Your Super Metric,” on
page 106.
n
Associate your super metric to a an object type. See “Associate Your Super Metric with an Object Type,”
on page 107.
Procedure
1 Select Environment > All Objects.
2 Under vCenter Adapter, expand Host System and select one of the objects.
3 On the Troubleshooting tab, select All Metrics.
4 Scroll down the metrics list to expand Super Metric and double-click SM-AvgVMCPUUsage% to view the
average CPU usage for all virtual machines that are children of the host you selected.
If the average CPU usage is low, system performance is good and your customers should not experience
long transaction processing times. You can continue monitoring the super metric for changes in average
CPU usage that might aect the customer experience. If the average CPU usage uctuates, enable the super
metric in a custom policy associated with the host objects to send an alert when the super metric value
reaches an unacceptable threshold.
Building a Super Metric Formula
A super metric formula can include one or more metric specications, super metric functions, arithmetic
operators such as the plus or minus sign, and constants. You can enter any number of constants as part of
the formula.
Procedure
u
Use the correct procedures and rules to build a super metric formula in the
vRealize Operations Manager user interface.
Option Action
To use a function.
Select it from the Function drop-down menu. Select the object or object
type, and metric or aribute type to use in its argument. The database IDs
of the object and metric appear in the formula line at the top of the
window.
To select an object and metric
Click the object in the Objects pane and double-click the metric in the
Metrics pane.
Define a metric for the object to
which the super metric is assigned.
a
Click the This Object icon or enter this on the formula line.
If the This Object icon is not selected, the super metric functions
display the object with a long description.
b In the Objects pane, click an object that contains the metric to use.
c In the Metrics pane, double-click the metric.
vRealize Operations Manager Customization and Administration Guide
108 VMware, Inc.