
6.5
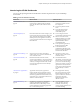
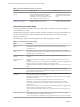
Table Of Contents
- VMware vRealize Operations for Published Applications Installation and Administration
- Contents
- VMware vRealize Operations for Published Applications Installation and Administration
- Introducing vRealize Operations for Published Applications
- System Requirements for vRealize Operations for Published Applications
- Installing and Configuring vRealize Operations for Published Applications
- Install and Configure vRealize Operations for Published Applications
- Downloading the vRealize Operations for Published Applications Installation Files
- Install the vRealize Operations for Published Applications Solution
- Open the Ports Used by vRealize Operations for Published Applications
- Adding a vRealize Operations for Published Applications License Key
- Associate XD-XA Objects with Your vRealize Operations for Published Applications License Key
- Create an Instance of the vRealize Operations for Published Applications 6.5 Adapter
- Enabling Firewall Rules for XenDesktop Delivery Controllers and PVS Server
- Install the vRealize Operations for Published Applications Broker Agent
- Configure the vRealize Operations for Published Applications Broker Agent
- Configure Broker Agent to use Non-Admin User for Citrix Desktop Delivery Controller
- Install a vRealize Operations for Published Applications Desktop Agent
- Push the vRealize Operations for Published Applications Desktop Agent Pair Token Using a Group Policy
- Install and Configure vRealize Operations for Published Applications
- Enable PowerShell Remoting on the Server
- Enabling HTTP or HTTPS Protocols for PowerShell Remoting
- Monitoring Your Citrix XenDesktop and Citrix XenApp Environments
- Managing RMI Communication in vRealize Operations for Published Applications
- Changing the Default TLS Configuration in vRealize Operations for Published Applications
- Managing Authentication in vRealize Operations for Published Applications
- Certificate and Trust Store Files
- Replacing the Default Certificates
- Certificate Pairing
- SSL/TLS and Authentication-Related Log Messages
- Upgrade vRealize Operations for Published Applications
- Create a vRealize Operations Manager Support Bundle
- Download vRealize Operations for Published Applications Broker Agent Log Files
- Download vRealize Operations for Published Applications Desktop Agent Log Files
- View Collector and vRealize Operations for Published Applications Adapter Log Files
- Modify the Logging Level for vRealize Operations for Published Applications Adapter Log Files
- Index
Use the Selected Session Related Objects widget to look at the related object of the selected session .
Use the Session Related Metrics widget to metrics of selected session, Health, Workload, Logon Time, ICA
Round Trip Latency, ICA Input Bandwidth, and ICA Output Bandwidth. Additionally, if a session has any
associated App Volumes App Stacks, they will show up in the Atached App Stacks column.
Use the Session Logon Breakdown widget to view important logon metrics, Brokering Duration, HDX
Connection Duration, Authentication Duration, GPO duration, App Volumes App Stack Aach Time,
Prole Load Duration, and Interactive Duration.
Run actions in the Session Processes widget to obtain information about in-guest desktop processes and
their resource usage, including CPU, memory, and I/O use. The Get Desktop Processes and Get Desktop
Services actions can help you determine which desktop processes and applications are using the most
resources. The Get Desktop/Client Traceroute action provides information about network distance and
quality between the desktop and client .
Use the Machine Object widget to show the machine object (created by
vRealize Operations for Published Applications) of selected session.
Use the Virtual Machine widget to show the related virtual machine of selected session.
Use the VM Metrics widget to show metrics of related virtual machine, VM Health, VM Workload, CPU,
CPU Ready, CPU Contention, Co-stop, vCPU Count, vCPU recommended, Memory, Disk Latency, Disk
IOPs, and Memory Swap.
Use the Client widget to show the client info of selected session.
Use the VM Host widget to show the ESXi host of the related VM that is hosting the selected session.
Use the Host Metrics widget to show metrics of the related host.
XD-XA Server Desktops
Use the XD-XA Servers dashboard to assess server metrics and related vSphere VMs, server resource
utilization, and server indicator metrics.
Tips for using the XD-XA Server Desktops Dashboard
n
Use the Virtual Machine of Session-host Server widget to view the badge health and badge workload
for the VM of the session-host server.
n
Use the Session-host Server Resource Utilization widget to view the CPU Processor Time, Disk Read
and Write, and Memory Available.
n
Use the Top Alert and Session-host Servers widget to view the server alerts and server summary data.
n
Use the Session-host server resource utilization widget to view server resource utilization data.
n
Use the Session-host Server Indicator Metrics widget to view server users and sessions summary data.
XD-XA Session Details
Use the XD-XA Session Details dashboard to view detailed information about sessions, application sessions,
and server sessions.
Tips for using the XD-XA Session Details Dashboard
n
To view session processes, select a session from the Sessions widget and view the information in the
Session Processes widget.
n
Use the Session Indicator Metrics widget to view session health, reconnect duration, logon duration,
prole load duration, session duration and session state.
VMware vRealize Operations for Published Applications Installation and Administration
40 VMware, Inc.