
6.4
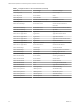
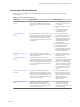
Table Of Contents
- VMware vRealize Operations for Published Applications Installation and Administration
- Contents
- VMware vRealize Operations for Published Applications Installation and Administration
- Introducing vRealize Operations for Published Applications
- System Requirements for vRealize Operations for Published Applications
- Installing and Configuring vRealize Operations for Published Applications
- Install and Configure vRealize Operations for Published Applications
- Downloading the vRealize Operations for Published Applications Installation Files
- Install the vRealize Operations for Published Applications Solution
- Open the Ports Used by vRealize Operations for Published Applications
- Adding a vRealize Operations for Published Applications License Key
- Associate XD-XA Objects with Your vRealize Operations for Published Applications License Key
- Create an Instance of the vRealize Operations for Published Applications 6.4 Adapter
- Enabling Firewall Rules for XenDesktop Delivery Controllers and PVS Server
- Install the vRealize Operations for Published Applications Broker Agent
- Configure the vRealize Operations for Published Applications Broker Agent
- Configure Broker Agent to use Non-Admin User for Citrix Desktop Delivery Controller
- Install a vRealize Operations for Published Applications Desktop Agent
- Push the vRealize Operations for Published Applications Desktop Agent Pair Token Using a Group Policy
- Install and Configure vRealize Operations for Published Applications
- Enable PowerShell Remoting on the Server
- Enabling HTTP or HTTPS Protocols for PowerShell Remoting
- Monitoring Your Citrix XenDesktop and Citrix XenApp Environments
- Managing RMI Communication in vRealize Operations for Published Applications
- Changing the Default TLS Configuration in vRealize Operations for Published Applications
- Managing Authentication in vRealize Operations for Published Applications
- Certificate and Trust Store Files
- Replacing the Default Certificates
- Certificate Pairing
- SSL/TLS and Authentication-Related Log Messages
- Upgrade vRealize Operations for Published Applications
- Create a vRealize Operations Manager Support Bundle
- Download vRealize Operations for Published Applications Broker Agent Log Files
- Download vRealize Operations for Published Applications Desktop Agent Log Files
- View Collector and vRealize Operations for Published Applications Adapter Log Files
- Modify the Logging Level for vRealize Operations for Published Applications Adapter Log Files
- Index

Table 7‑3. Understanding the Health Badge (Continued)
Object Description
XD-XA PVS The PVS Server is not reachable from XD Controller alert is triggered when PVS server is not
reachable.
XD-XA Store Front StoreFront Server cannot be accessed alert is triggered when store front service is down.
Published Apps Adapter is not Receiving Data from the desktop agent alert is triggered when
Desktop agent is not working on the Store Front.
StoreFront Performance Problem alert is triggered when CPU processor time is too high.
XD-XA Site The Site Database service has Failed alert is triggered when site database is down.
This alert is triggered in the following scenarios:
A site performance problem has been detected. One or more store front servers of this site
have performance problem. Check the CPU usage or memory for possible cause.
A site performance problem has been detected. One or more license servers of this site have
performance problem. Check the CPU usage or memory for possible cause.
A site performance problem has been detected. One or more delivery controllers of this site
have performance problem. Check the CPU usage or memory for possible cause.
A site performance problem has been detected. One or more desktop os machines of this site
have performance problem. Check the CPU usage or memory for possible cause.
A site performance problem has been detected. One or more server os machines of this site
have performance problem. Check the CPU usage or memory for possible cause.
XD-XA Server OS
machine
Published Apps Adapter is not receiving data from the desktop agent alert is triggered when
Desktop agent is not working on session host machine.
Server OS Machine Performance Problem alert is triggered when CPU processor time is too
high.
XD-XA Overview
The XD-XA Overview dashboard shows the overall status of your environment. Use the XD-XA Overview
dashboard to visualize the end-to-end XenDesktop and XenApp environments, XD-XA-related alerts, key
Site metrics, and Site-related vCenter capacity.
Tips for using the XD-XA Overview Dashboard
n
To view the overall status of a Site, view the values of the Site Session Metrics and Site Capacity Metrics
widgets.
n
Use the Virtual Machine of Controller Server widget to view badge health and badge workload for the
VM of the controller server.
n
To view the overall status of a Site, view the Top Alerts, values of the Site Session Metrics widgets.
n
To view the overall capacity of the site related vCenter, view Remaining Capacity and reclaimable
capacity widgets.
XD-XA Help Desk
Thee Help Desk dashboard helps you view detailed information about all sessions running in your
environment. The Sessions Details widget lists all the connected VDI desktop sessions, RDS desktop
sessions, and application sessions in your environment and is the master widget for the dashboard.
Tips for using the Help Desk Dashboard
Use the All Environment Alerts widget to view all existing alerts of the system. Click each alert to view
detailed information.
Use the Selected User Session Alerts widget to view alerts of the selected session. Click each alert to view
detailed information.
Chapter 7 Monitoring Your Citrix XenDesktop and Citrix XenApp Environments
VMware, Inc. 39