
6.4
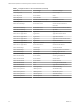
Table Of Contents
- VMware vRealize Operations for Published Applications Installation and Administration
- Contents
- VMware vRealize Operations for Published Applications Installation and Administration
- Introducing vRealize Operations for Published Applications
- System Requirements for vRealize Operations for Published Applications
- Installing and Configuring vRealize Operations for Published Applications
- Install and Configure vRealize Operations for Published Applications
- Downloading the vRealize Operations for Published Applications Installation Files
- Install the vRealize Operations for Published Applications Solution
- Open the Ports Used by vRealize Operations for Published Applications
- Adding a vRealize Operations for Published Applications License Key
- Associate XD-XA Objects with Your vRealize Operations for Published Applications License Key
- Create an Instance of the vRealize Operations for Published Applications 6.4 Adapter
- Enabling Firewall Rules for XenDesktop Delivery Controllers and PVS Server
- Install the vRealize Operations for Published Applications Broker Agent
- Configure the vRealize Operations for Published Applications Broker Agent
- Configure Broker Agent to use Non-Admin User for Citrix Desktop Delivery Controller
- Install a vRealize Operations for Published Applications Desktop Agent
- Push the vRealize Operations for Published Applications Desktop Agent Pair Token Using a Group Policy
- Install and Configure vRealize Operations for Published Applications
- Enable PowerShell Remoting on the Server
- Enabling HTTP or HTTPS Protocols for PowerShell Remoting
- Monitoring Your Citrix XenDesktop and Citrix XenApp Environments
- Managing RMI Communication in vRealize Operations for Published Applications
- Changing the Default TLS Configuration in vRealize Operations for Published Applications
- Managing Authentication in vRealize Operations for Published Applications
- Certificate and Trust Store Files
- Replacing the Default Certificates
- Certificate Pairing
- SSL/TLS and Authentication-Related Log Messages
- Upgrade vRealize Operations for Published Applications
- Create a vRealize Operations Manager Support Bundle
- Download vRealize Operations for Published Applications Broker Agent Log Files
- Download vRealize Operations for Published Applications Desktop Agent Log Files
- View Collector and vRealize Operations for Published Applications Adapter Log Files
- Modify the Logging Level for vRealize Operations for Published Applications Adapter Log Files
- Index

Introducing the XD-XA Dashboards
You can use the precongured XD-XA dashboards to monitor the performance of your XenDesktop
environment.
Table 7‑2. XD-XA Dashboard Summary
Dashboard What It Shows When To Use It
“XD-XA Overview,” on
page 39
Status of your end-to-end XD-XA
environment, including the XD-XA-related
alerts, key Site metrics, Site related vCenter
capacity.
n
Assess overall XD-XA
performance, and the overall
user experience.
n
View the top XD-XA-related
alerts.
n
View Site related vCenter
remaining capacity and
reclaimable capacity.
“XD-XA Help Desk,” on
page 39
Information about all sessions running in your
environment. The Sessions Details widget lists
all of connected VDI desktop sessions, RDS
desktop sessions, and application sessions in
your environment and is the master widget for
the dashboard.
n
View existing alerts of the
system and the selected session.
n
Metrics of selected session,
Health, Workload, Logon Time,
ICA Round Trip Latency, ICA
Input Bandwidth, and ICA
Output Bandwidth.
n
View important logon metrics,
Brokering Duration, HDX
n
Connection Duration,
Authentication Duration, GPO
duration, Prole Load Duration,
and Interactive Duration.
“XD-XA Server Desktops,” on
page 40
Session-host server metrics and related
vSphere VMs, server resource utilization and
server indicator metrics.
n
Check servers alerts, server
indicator metrics, and resource
utilization metrics.
“XD-XA Session Details,” on
page 40
Detailed information of all the sessions,
session logon breakdown, session performance
metrics, running processes of the session, users
summary, User logon duration trend, and the
report of what application are launched by a
user and when.
n
Check detailed session
information, check session logon
details, retrieve session running
processes for trouble shooting,
check users summary, check user
logon duration trend, and look
at the report of what application
are launched by a user and
when.
“XD-XA Server Applications,”
on page 41
Application summary data, application
instance number trend, application instance
summary data, application instance resource
utilizaiton, application launch duration trend,
application users, Application related servers,
and server indicator metrics.
n
Check application summary
data, performance data, launch
duration historical trend, the
report of which users launched
applications and when,
application related server
indicator metrics.
“XD-XA VDI Desktops,” on
page 41
VDI Desktops related alerts, VDI Desktop
summary information and VDI session
detailed information, VDI desktop session
resource utilization, and running application
list of a VDI desktop session.
n
Check VDI Desktop overall
status, top alerts, resource
utilization, and retrieving
session running application list
for troubleshooting.
Chapter 7 Monitoring Your Citrix XenDesktop and Citrix XenApp Environments
VMware, Inc. 37