
6.2

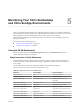
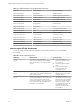
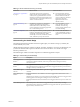
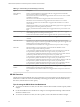
Table Of Contents
- VMware vRealize Operations for Published Applications Installation and Administration
- Contents
- VMware vRealize Operations for Published Applications Installation and Administration
- Introducing vRealize Operations for Published Applications
- System Requirements for vRealize Operations for Published Applications
- Installing and Configuring vRealize Operations for Published Applications
- Install and Configure vRealize Operations for Published Applications
- Downloading the vRealize Operations for Published Applications Installation Files
- Install the vRealize Operations for Published Applications Solution
- Open the Ports Used by vRealize Operations for Published Applications
- Adding a vRealize Operations for Published Applications License Key
- Associate XD-XA Objects with Your vRealize Operations for Published Applications License Key
- Create an Instance of the vRealize Operations for Published Applications 6.2 Adapter
- Enabling Firewall Rules for XenDesktop Delivery Controllers and PVS Server
- Install the vRealize Operations for Published Applications Broker Agent
- Configure the vRealize Operations for Published Applications Broker Agent
- Configure Broker Agent to use Non-Admin User for Citrix Desktop Delivery Controller
- Install a vRealize Operations for Published Applications Desktop Agent
- Push the vRealize Operations for Published Applications Desktop Agent Pair Token Using a Group Policy
- Install and Configure vRealize Operations for Published Applications
- Monitoring Your Citrix XenDesktop and Citrix XenApp Environments
- Managing RMI Communication in vRealize Operations for Published Applications
- Changing the Default TLS Configuration in vRealize Operations for Published Applications
- Managing Authentication in vRealize Operations for Published Applications
- Certificate and Trust Store Files
- Replacing the Default Certificates
- Certificate Pairing
- SSL/TLS and Authentication-Related Log Messages
- Create a vRealize Operations Manager Support Bundle
- Download vRealize Operations for Published Applications Broker Agent Log Files
- Download vRealize Operations for Published Applications Desktop Agent Log Files
- View Collector and vRealize Operations for Published Applications Adapter Log Files
- Modify the Logging Level for vRealize Operations for Published Applications Adapter Log Files
- Index

Table 5‑2. XD-XA Dashboard Summary (Continued)
Dashboard What It Shows When To Use It
“XD-XA Server Applications,”
on page 31
Application summary data, application
instance number trend, application instance
summary data, application instance resource
utilizaiton, application launch duration trend,
application users, Application related servers,
and server indicator metrics.
n
Check application summary
data, performance data, launch
duration historical trend, the
report of which users launched
applications and when,
application related server
indicator metrics.
“XD-XA VDI Desktops,” on
page 32
VDI Desktops related alerts, VDI Desktop
summary information and VDI session
detailed information, VDI desktop session
resource utilization, and running application
list of a VDI desktop session.
n
Check VDI Desktop overall
status, top alerts, resource
utilization, and retrieving
session running application list
for troubleshooting.
“XD-XA User Experience,” on
page 32
vCPU Experience heatmap, vDisk Experience
heatmap, vRAM Experience heatmap, vCPU
relationship, vDisk relationship, vRAM
relationship, vCPU chart, vDisk chart, vRAM
chart, and Delivery Group critical alerts.
n
Check overall and detailed
vCPU/vDisk/vRAM experience,
check delivery controller critial
alerts.
Understanding the Health Badge
The health badge indicates immediate issues that might require your attention. It helps you identify the
current health of your system.
vRealize Operations Manager combines workload, anomalies, and faults to assess the overall health of your
system and to determine the expected workload level in that environment. A low health score might
indicate a potential issue.
The health badge is enabled on vRealize Operations for Published Applications objects.
Table 5‑3. Understanding the Health Badge
Object Description
XD-XA Application
Instance
The Application Performance Problem alert is triggered when application instance
performance problem is detected, when CPU processor time is too high, or memory
consumed is more.
XD-XA Application
Session
The Application Session Network alert is triggered when the session latency is too high.
The Application Session performance Problem alert is triggered when CPU processor time is
too high or memory consumed is more.
XD-XA Broker Agent
Collector
Not receiving data from the Broker Agent alert is triggered when Broker agent is not
reachable.
XD-XA Desktop OS
Machine
Desktop OS Machine is not available for use alert is triggered when VDA machine is not
available
Published Apps Adapter is not receiving Data from the Desktop Agent alert is triggered when
Desktop agent is not working/not working on server on Store front.
Desktop OS Machine Performance Problem alert is triggered when CPU processor time is too
high.
XD-XA Desktop Session The Desktop Session Network alert is triggered when the session latency is too high.
The Desktop Session performance Problem alert is triggered when CPU processor time is too
high or memory consumed is more.
Chapter 5 Monitoring Your Citrix XenDesktop and Citrix XenApp Environments
VMware, Inc. 29