
6.2

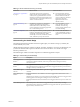
Table Of Contents
- VMware vRealize Operations for Published Applications Installation and Administration
- Contents
- VMware vRealize Operations for Published Applications Installation and Administration
- Introducing vRealize Operations for Published Applications
- System Requirements for vRealize Operations for Published Applications
- Installing and Configuring vRealize Operations for Published Applications
- Install and Configure vRealize Operations for Published Applications
- Downloading the vRealize Operations for Published Applications Installation Files
- Install the vRealize Operations for Published Applications Solution
- Open the Ports Used by vRealize Operations for Published Applications
- Adding a vRealize Operations for Published Applications License Key
- Associate XD-XA Objects with Your vRealize Operations for Published Applications License Key
- Create an Instance of the vRealize Operations for Published Applications 6.2 Adapter
- Enabling Firewall Rules for XenDesktop Delivery Controllers and PVS Server
- Install the vRealize Operations for Published Applications Broker Agent
- Configure the vRealize Operations for Published Applications Broker Agent
- Configure Broker Agent to use Non-Admin User for Citrix Desktop Delivery Controller
- Install a vRealize Operations for Published Applications Desktop Agent
- Push the vRealize Operations for Published Applications Desktop Agent Pair Token Using a Group Policy
- Install and Configure vRealize Operations for Published Applications
- Monitoring Your Citrix XenDesktop and Citrix XenApp Environments
- Managing RMI Communication in vRealize Operations for Published Applications
- Changing the Default TLS Configuration in vRealize Operations for Published Applications
- Managing Authentication in vRealize Operations for Published Applications
- Certificate and Trust Store Files
- Replacing the Default Certificates
- Certificate Pairing
- SSL/TLS and Authentication-Related Log Messages
- Create a vRealize Operations Manager Support Bundle
- Download vRealize Operations for Published Applications Broker Agent Log Files
- Download vRealize Operations for Published Applications Desktop Agent Log Files
- View Collector and vRealize Operations for Published Applications Adapter Log Files
- Modify the Logging Level for vRealize Operations for Published Applications Adapter Log Files
- Index

Monitoring Your Citrix XenDesktop
and Citrix XenApp Environments 5
When you install the vRealize Operations for Published Applications solution, preconfigured dashboards
and predefined report templates appear in the vRealize Operations Manager user interface. You can use the
Citrix XenDesktop and Citrix XenApp dashboards and reports along with the standard
vRealize Operations Manager object monitoring features to monitor your Citrix XenDesktop and Citrix
XenApp environments.
This chapter includes the following topics:
n
“Using the XD-XA Dashboards,” on page 27
n
“Using the XD-XA Reports,” on page 32
Using the XD-XA Dashboards
The XD-XA dashboards are in the Published Applications group in the Dashboard List menu in the
vRealize Operations Manager user interface.
Widget Interaction in XD-XA Dashboards
vRealize Operations Manager supports interaction between widgets in a single dashboard. Widgets are
combined so that the content of the destination widget is updated according to the value selected in the
source widget.
For information about creating and modifying dashboards and customizing widgets see
vRealize Operations Manager Customization and Administration Guide.
Table 5‑1. Widget Interaction in XD-XA Dashboards
Dashboard Source Widget Destination Widget
XD-XA Overview Sites Site Capacity Metrics
XD-XAOverview Sites Site Session Metrics
XD-XA Server Desktops Session-host Servers Session Host Server Resource
Utilization
XD-XA Servers Desktops Session-host Servers Session Host Server Indicator Metrics
XD-XA Servers Applications Applications Application Instance Trend
XD-XA Servers Applications Applications Application Instances
XD-XA Servers Applications Applications Application Launch Duration Trend
XD-XA Servers Applications Applications Application Users
XD-XA Servers Applications Applications Instances Application Instance Resource Trend
XD-XA Servers Applications Session Host Servers Session Indicator Metrics
VMware, Inc. 27