
6.4

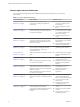
Table Of Contents
- VMware vRealize Operations for Horizon Administration
- Contents
- VMware vRealize Operations for Horizon Administration
- Monitoring Your Horizon Environment
- Using the Horizon Dashboards
- Introducing the Horizon Dashboards
- Horizon Overview Dashboard
- Horizon Help Desk Dashboard
- Horizon Infrastructure Dashboard
- Horizon User Sessions Dashboard
- Horizon VDI Pools Dashboard
- Horizon RDS Pools Dashboard
- Horizon Applications Dashboard
- Horizon Desktop Usage Dashboard
- Retrieve In-Guest Process Data for Desktop Sessions
- Horizon User Session Details Dashboard
- Retrieve In-Guest Process Data for Session Objects
- Horizon RDS Host Details Dashboard
- Retrieve In-Guest Process Data for Host Objects
- Horizon Adapter Self Health Dashboard
- Horizon End User Experience Dashboard
- Horizon Root Cause Analysis Dashboard
- Using the Horizon Reports
- Using the Horizon Alerts
- Using the Horizon Dashboards
- Maintaining vRealize Operations for Horizon
- Troubleshooting a vRealize Operations for Horizon Installation
- Create a vRealize Operations Manager Support Bundle
- Download vRealize Operations for Horizon Broker Agent Log Files
- Download vRealize Operations for Horizon Desktop Agent Log Files
- View the Collection State and Status of a Horizon Adapter Object
- Horizon Collector and Horizon Adapter Log Files
- Modify the Logging Level for Horizon Adapter Log Files
- Remove Adapter Instance
- Cleanup Objects
- Firewall Rules
- Licensing
- Communication Issues Between Horizon Adapter and Agents
- Post Upgrade Configurations
- Agents-Related Issues
- Missing Metrics
- Missing Logon Duration
- Index

Table 1‑1. Horizon Dashboard Summary (Continued)
Horizon Dashboard What It Shows When To Use It
“Horizon RDS Host Details
Dashboard,” on page 16
Detailed information about the RDS hosts in
your Horizon environment.
n
View desktop and application
sessions currently running on
selected RDS hosts
n
Identify when RDS host
problems occurred
n
Collect and view in-guest
process data from RDS hosts
“Horizon Adapter Self Health
Dashboard,” on page 17
Health information for your Horizon adapters
and the broker agents connected to those
adapters. This dashboard also contains license
compliance information.
n
Troubleshoot Horizon adapter
problems
n
Monitor license use
“Horizon End User Experience
Dashboard,” on page 18
Health information for your resources.
n
Troubleshoot problems related
to vCenter resources adapter.
“Horizon Root Cause Analysis
Dashboard,” on page 19
Detailed information on specic metrics,
including performance over time.
n
Troubleshoot problems related
to specic object-related metrics.
Horizon Overview Dashboard
The Horizon Overview dashboard shows the overall status of your Horizon environment. Use the Horizon
Overview dashboard to visualize the end-to-end environment, its underlying environment, and alerts.
The Horizon Top Alerts widget shows the alerts of the greatest signicance for Horizon objects. When you
select a pod in the Horizon Pods widget, the Pod Indicator Metrics, Pod Session Metrics, and Pod Capacity
Metrics widgets show data for the pod that you selected.
Tips for Using the Horizon Overview Dashboard
n
Click an alert in the Horizon Top Alerts widget to open the alert details.
n
Use the Horizon Pods widget to determine the total number of sessions, including the number of
connected and disconnected sessions, for a selected pod. Use the Pod Session Metrics widget to view
desktop, application, PCoIP, RDP, and Blast metrics.
n
The vCenter Server Instance widget shows the vCenter that the View pod is associated with. It includes
vCenter name, vCenter CPU capacity usage, vCenter usable memory, vCenter disk capacity remaining,
and collecting status.
n
The Capacity remaining widget shows the capacity related information of the selected vCenter in
vCenter Server Instance widget. It shows the graph of used capacity and remaining capacity.
n
The Reclaimable Capacity widget shows the reclaimable capacity of the selected vCenter in the vCenter
Server Instance widget. It shows the reclaimable CPU, memory, and disk. It also shows the percentage
of VMs in dierent status.
n
Use the Access Point widget to see the status of multiple Access Points, including blast and PCoIP
session counts, usage percentage (i.e., the percentage of the maximum number of sessions actually
used), IP addresses, and collection status. Select an Access Point from the list and click on the Object
Details icon to details about each Access Point (e.g., health and active alerts); you can also congure
alert thresholds for session usage.
You can congure the session level usage for an Access Point that triggers an alert. For example, you
may want to trigger an alert if session usage reaches 90% of an AD's capacity. To do so:
a Click Home.
b Click Content in the vRealize Operations Manager for Horizon's sidebar.
c Click Symptom and Metric/Property Symptom .
Chapter 1 Monitoring Your Horizon Environment
VMware, Inc. 9